Programme: Updated Gantt Chart View
This announcement represents a single point in time. Future releases may impact the information below.
Feature Announced: December 18, 2019 / Feature Released: February 25, 2020
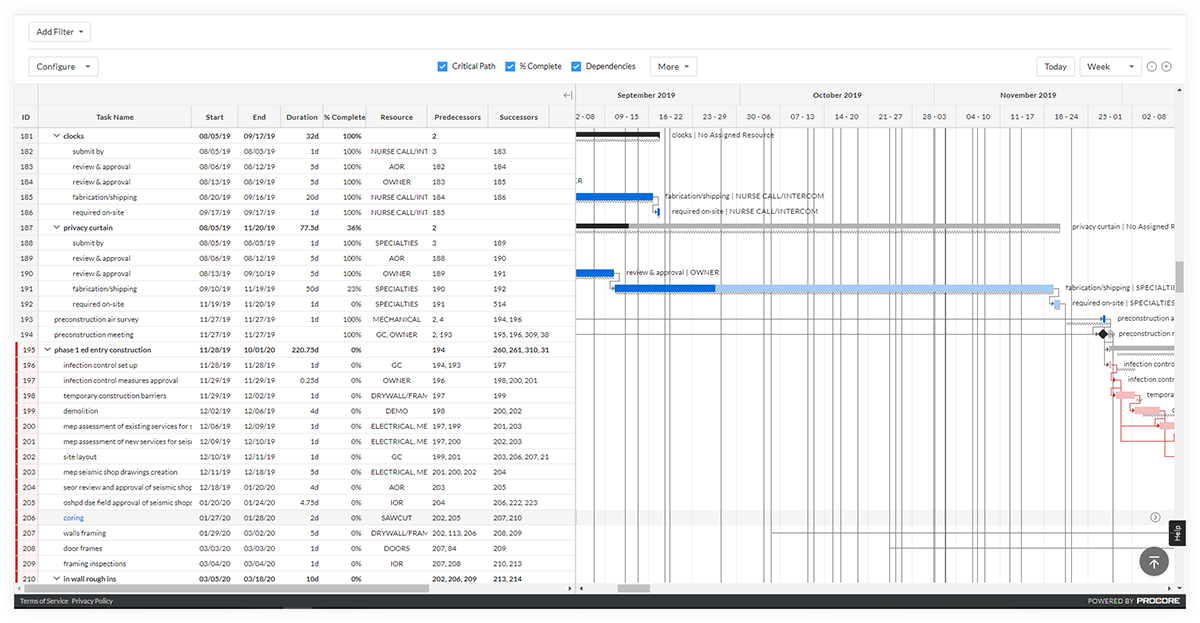
Redesign of the Gantt Chart View for the Project Level Programme Tool
The Gantt view of the Project level Programme tool has been redesigned with a refined look and expanded functionality. This update makes it easier to navigate through the programme and view important information. See View a Project Programme.
Note
Since the updated Gantt chart provides a more comprehensive and flexible experience with several new features, the Microsoft Project Viewer in Procore has been removed. In addition, the Gantt Chart settings (such as 'Enable MS Project Viewer Gantt Chart' and Task Level colours) are no longer available in the Programme tool's Configure Settings page.The Gantt chart will continue to receive additional updates in the near future. Below is a list of some of the enhancements that were included in the initial phase of the redesign:
- Full Screen Viewing Mode: To view more of the programme at once.
- New 'Upload Programme' Button in the Tool Header: For quicker access if uploading a programme through Procore Web.
- New 'Today' Button: Quickly return to the current date in the programme view.
- Enhanced Zoom Levels:
- Dropdown menu for Day, Week, Month, Quarter and Year.
- + and - zoom buttons that increment column widths.
Note: There will be a varied number of increments based on the browser window size.
- New View Toggles:
- On a small browser window, options will be collapsed into one drop-down menu:
- Critical Path, % Complete, Dependencies, Baselines, Task Names in Chart, Resources in Chart
- Ability to toggle 'Critical Path' and 'Dependencies' on or off on the programme view.
- Ability to jump to a programme task's location in chart.
- On a small browser window, options will be collapsed into one drop-down menu:
- New Configure Drop-Down Menu:
- Hide, show and reorder columns imported from a programme file:
- Task Name, Start Date and Finish Date.
- New options: Duration, % Complete, Resource, Predecessors, Successors, Activity ID, WBS, Notes, Baseline Start and Baseline Finish.
- Additional options:
- Expand All or Collapse All Tasks.
- Change Row Height.
- Hide, show and reorder columns imported from a programme file:
- Enhanced Filtering:
- Filters can be combined and will function similar to Microsoft Project (for example, how date ranges and collapsed tasks are handled).
- Filter options will include: Date Range, Resource, Critical Path, Milestones, Summary Tasks, Completed Tasks and Incomplete Tasks.
- Date Range will pull in four types of tasks and their summary tasks:
- Task starts and ends within selected date range.
- Task starts before and ends after selected date range.
- Task starts before and ends within selected date range.
- Task starts within and ends after selected date range.
- Improved Navigation:
- To jump to a task bar:
- Click anywhere in a row in the grid (besides the task name link).
OR - Click the chevron that appears when hovering over a row.
- Click anywhere in a row in the grid (besides the task name link).
- To link to the Task Details page:
- Click the name of task in the Grid Clicking bar.
OR - Click the name of task in chart when hovering over a row.
- Click the name of task in the Grid Clicking bar.
- To jump to a task bar:
- Updated Hover Behaviour on Rows:
- The row you are currently hovering over will be highlighted.
- A chevron will indicate where a task is if it is out of view (you will be able to click to jump to the task).
- When hovering over the task bar, you will see the following: Name, Start and End Dates, Resource, and % Complete.
- New Grid Customization:
- Ability to resize columns (minimum 48px).
- Resize grid vs. chart.
- Collapse/Expand whole grid.
- Show/Hide columns.
- Support for Saved Settings
- The following areas will be 'sticky', meaning your last used settings will be preserved for your next session:
- Applied filters.
- Hidden/Visible columns, ordering, sizing.
- Zoom level “View” toggles.
- Further configurations (such as collapsed tasks, row heights, etc.).
- The following areas will be 'sticky', meaning your last used settings will be preserved for your next session:
- Enhanced Scrolling:
- There will be an independent horizontal scroll for the grid vs. chart.
- The vertical scroll will automatically bring the entire Gantt chart into full screen view.
Note: This view still allows access to applied filters, configuration, view toggles and zoom. - Addition of a 'Back to Top' button.
Preview
See Also
If you would like to ask questions or share any feedback, please contact support@procore.com.