Analytics 2.0 Reports
Table of Contents
- Action Plan Report
- Adoption Report
- Core Report
- Site Diaries Report
- Design Co-ordination Report
- Financials Budget (Custom) Report
- Financials Budget Report
- Financials Report
- Owner Report
- Project Management Report
- Quality & Safety Report
- Risk Report
- Resource Management Report
- Vendor Performance Report
- BSA Compliance Scorecard (UK) Report Template
- Preconstruction Report (Beta)
Action Plan Report
The Analytics Action Plans Report is a specialised report designed to help users track and manage action plans within their projects on the Procore platform. This report provides detailed insights and visualisations related to the progress and performance of action plans, ensuring that project teams can effectively manage tasks and meet their project goals.
Current Versions
- 2.0 - 25.03.13
Procore Tools Used in the Actions Plans Report
- Action Plans
Report Pages
Click the report pages below to view a sample report page.
Insights
The Action Plans Insights report page offers a variety of visuals that deliver insights into Action Plans data, including details on Plan Approval Status, Item Assignment Status and more.

Matrix
The Action Plans Matrix provides users with all of the detailed information available within their action plans.

Action required by
The Action required by Report for Action Plans shows a high-level view of stakeholder responsibility in user action plans, ensuring accountability and clarity around the progression of tasks or approvals.

Progress
As part of the Procore Analytics Action Plan Report, the Progress Report provides users with a high-level view of their action plan item completion percentage. The templates and locations are in alphanumeric order so the report can will give users a better view if the templates and locations are ordered accordingly. This page can be toggled between a bar chart, a gantt chart and a progress matrix style view.

Key Influencers
As part of the Procore Analytics Action Plan Report, the Key Influencers Report analyses factors contributing to the percentage of late action plan items.
Root Cause Analysis
As part of the Procore Analytics Action Plans Report, the Root Cause Analysis Report analyses factors contributing to late items on actions place with a corresponding percentage score.

Data Quality
As part of the Procore Analytics Action Plan Report, the Data Quality Report shows users which fields may be missing data in Procore.

Change History
As part of the Procore Analytics Action Plan Report, the Change History Report shows all changes made to all action plans.

Adoption Report
The Adoption Report gives Analytics customers a comprehensive view of their adoption and usage patterns across the Procore platform in one place. The report identifies adoption and usage trends by projects, partners, people and many other indicators.
Current Versions
- 2.0 - 25.03.13
Procore Tools Used in the Adoption Report
|
|
Report Pages
Leaderboard
As part of the Analytics Adoption Report, the Leaderboard Report gives you a comprehensive view of which projects are leading the charge in leveraging Procore. You can also see which projects are lagging behind. Analyse your data by project, office, region, user and many more fields to gain further insights.
Record Creation Analysis
The Record Creation Analysis report page is highly configurable and enables analysis across many predefined metrics. Customers can configure which metric they want to review and analyse the underlying data.
Collaborator Analysis
As part of the Procore Adoption Report, the Collaborator Analysis Report lets you analyse how your partners or collaborators are leveraging Procore. The report allows you to define a target KPI, which can be used to measure progress toward your collaborator adoption goals. Overall, this report can be used to guide conversations with your partners to ensure all your business processes and workflows are happening within the Procore platform.
Benchmark Analysis
As part of the Analytics Adoption Report, the Benchmark Analysis Report is a highly configurable report that compares one or more projects against a benchmark set of data. The report allows you to compare your initial data set with a benchmark categorized by project, project type, office, square footage and the project's estimated value. The Benchmark Analysis Reports can also help you see if an ongoing project is producing data in a way similar to past projects of the same type.
Tool Configuration
This report is very similar to the old Tool Configuration page found in the Procore Core report. This page enables the user to understand the consistency of tools as they are rolled out across their portfolio of projects.
Data Quality
The Data Quality report page enables the user to understand data quality metrics on their project records. The report gives them quick insights and helps them quickly address missing data. By filling in missing values, additional capabilities such as benchmarking and trend analysis across Analytics are possible.
Configuration
The Configuration report page has a number of configuration options that can be selected. These include: tools to report usage on, email domains and collaborator record creation %. See Configure the Analytics Adoption Report.
Core Report
The Analytics Core Report is a comprehensive report designed to provide insights into various aspects of project performance and management within the Procore platform. It leverages data from Procore's project management software to generate visualisations, metrics and key performance indicators (KPIs) that help users monitor and analyse their projects.
Current Versions
- 2.0 - 25.03.13
Procore Tools Used in the Core Report
- Admin
- Directory
Report Pages
Core Insights
As the main landing page of the Analytics Core Report, the Core Insights report page provides users with a number of visuals with basic information from all other report pages in the Core Report.
Companies
As part of the Analytics Core Report, the Companies report page provides basic information about companies in to the Company level Directory tool. Information such as each company's address and authorized tenderer status are displayed, as well as a map of all companies.
Company Insurance
As part of the Analytics Core Report, the Company Vendor Insurance Compliance report page allows users to audit the Company level insurance compliance for each company in the Company level Directory tool. Adjusting the 'Minimum Limit Required' slicer immediately updates the compliance data in the other visuals in the report page based on the amount set.
Company Vendor Insurance Compliance
As part of the Analytics Core Report, the Company Vendor Insurance Compliance report page allows users to audit the Company level insurance compliance for each company in the Company level Directory tool. Adjusting the 'Minimum Limit Required' slicer immediately updates the compliance data in the other visuals in the report page based on the amount set.
Users
As part of the Analytics Core Report, the Users report page provides basic information about all users within the company's Procore account.
Company Permission Matrix
As part of the Analytics Core Report, the Company Permission Matrix report page displays data based on the default permission template assigned to users in the Company level Directory tool.
Project Permission Matrix
As part of the Analytics Core Report, the Project Permission Matrix report page displays data based on the permission templates assigned to all users in all projects.
Project Tasks
As part of the Analytics Core Report, the Project Permission Matrix report page displays data based on the permission templates assigned to all users in all projects.
Maps
As part of the Analytics Core Report, the Maps report page shows an interactive map of all active projects. The map view can be categorized by Project Type, User, Client, Office, Program and Region.
Site Diaries Report
The Analytics Site Diaries Report is a comprehensive tool designed to track, manage and report daily project activities in construction management. This report leverages data from the Procore Site Diary tool to provide detailed insights into various aspects of daily operations.
Current Versions
- 2.0 - 25.02.17
Procore Tools Used in the Site Diaries Report
Site Diary
Report Pages
Log Insights
Log Compliance
Manpower Compliance
Accidents
Calls
Construction
Delays

Delays
Skip
Equipment
Inspections
Manpower
Notes
Productivity

Quantities

Safety Violations

Visitors

Waste
Weather
Design Co-ordination Report
The Analytics Co-ordination Issues Report is a specialised report within the Analytics suite that focuses on tracking and managing co-ordination issues in construction projects.
Current Versions
- 2.0 - 25.03.13
Procore Tools Used in the Design Co-ordination Report
Coordination Issues
Report Pages
Co-ordination Issues
Financials Budget (Custom) Report
Gain a flexible perspective on your budget data with Procore's Financials Budget custom report. Customise the view to prioritise the information most relevant to your role and project needs. This report consolidates crucial financial aspects, empowering you to effectively track and analyse budget performance for better project control.
Current Versions
- 2.0 - 25.03.13
Procore Tools Used in the Financials Budget Report
- Budget
- Change Events
Report Pages
Budget Changes
Budget Insights
Key Influencers
Root Cause Analysis
Budget Detail
Budget Benchmarking
Budget Snapshot Insights
Budget Snapshots Over Time Insights
Budget Snapshot Forecast
Budget Snapshot Comparison
Budget Modifications
Advanced Forecasting
Advancing Forecasting Over Time
Cost vs Programme
Change Events
Financials Budget Report
The Analytics Financials Budget Report is a powerful tool within the Procore platform, designed to offer comprehensive insights into project budget data. This report integrates various financial aspects of project management, helping users track and analyse budget performance in detail.
Current Versions
- 2.0 - 25.03.13
Procore Tools Used in the Financials Budget Report
- Budget
- Change Events
Report Pages
Budget Changes
Budget Insights
Key Influencers
Root Cause Analysis
Budget Detail
Budget Benchmarking
Budget Snapshot Insights
Budget Snapshots Over Time Insights
Budget Snapshot Forecast
Budget Snapshot Comparison
Budget Modifications
Advanced Forecasting
Advancing Forecasting Over Time
Cost vs Programme
Change Events
Financials Report
The Analytics Financials Report provides in-depth insights into the financial aspects of construction projects. This report integrates various financial data from the Procore platform to help project managers, financial controllers and other stakeholders track, analyse and manage project finances effectively.
Current Versions
- 2.0 - 25.03.13
Procore Tools Used in the Financials Report
- Commitments
- Variations
- Direct Costs
- Main Contracts
Report Pages
Financial Insights
Direct Costs
Main Contract Variation Insights
Main Contracts
Main Contracts Payments vs Value
Main Contract Main Contract Payment Applications
Main Contract Payments Received
Main Contract Owner Payment Reconciliation
Subcontractor Payment applications
Commitment Payments Issued
Subcontractor Payment Reconciliation
Main Contract Variation Requests
Main Contract Variation Potentials
Main Contract Variation Packages
Commitment Variation Contracts
Commitment Purchase Order Variations
Commitment Work Order Contracts
Commitment Work Order Variations
Owner Report
The Analytics Owner Report is a specialised report designed to provide project owners with comprehensive insights into various aspects of their construction projects. This report aggregates data from multiple tools within the Procore platform to deliver a high-level overview and detailed analysis tailored to the needs of project owners.
Current Versions
- 2.0 - 25.03.13
Procore Tools Used in the Owner Report
- Budget
- Change Events
- Programme
Prerequisites
In order for the Analytics Owner Report to function properly and to pull the appropriate project information into the report pages, a budget view titled Anticipated Cost Report must be created with specific columns. See Set Up the Anticipated Cost Report Budget View for the Analytics Owner Report.
Report Pages
Status Report
Programme Task Insights
Key Influencers
Root Cause Analysis
Budget Insights
Budget Benchmarking
Budget Snapshots Over Time
Budget Snapshot Comparison
Advanced Forecasting
Advanced Forecasting Over Time
Cost vs Programme
Change Events
Project Management Report
The Analytics Project Management Report is a robust reporting tool designed to provide comprehensive insights into various aspects of project management within the Procore platform. This report helps project managers, stakeholders and team members track, analyse and improve project performance by leveraging data from multiple project management tools within Procore.
Current Versions
- 2.0 - 25.03.13
Procore Tools Used in the Project Management Report
- Correspondence
- Directory (Project level)
- Drawings
- Meetings
- Photos
- Snag List
- RFIs
- Programme (Project level)
- Submittals
Report Pages
Project Insights
Project Scorecard
Key Influencers
Root Cause Analysis
Project Health Chart
Project Status Report
Project Tool Utilization
The Project Tool Utilization report includes a summary of your company's Projects By Stage, with a count of the project(s) in each stage of construction. By applying the Project, Project Role and Project User filters, you can include all available data or narrow the data plotted.
- The Project Tool Utilization table groups your WBS cost code segment data (see Where is the 'Division' in the 'Cost Code' segment in Procore's WBS?) by office location. See Add an Office Location and Assign an Office Location to a Project.
- The columns in the Project Tool Utilization table provide counts and a colour-coded heat map to show the number of items created.
Project Trending
Action required by
Projects
Project Dates
Project Vendor
Project Vendor Insurance
Project Vendor Insurance Compliance
Project Role Matrix
Project Resource Plan
Programme Task Insights
Programme Task Status
Programme Task Gantt
Programme Tasks
Programme ToDo Gantt
Programme ToDos
Meetings
Drawing Revisions
Photos
RFI Insights
RFIs
Submittal Insights
Submittals
Submittal Approvers
Correspondence Insights
Correspondences
Quality & Safety Report
The Analytics Quality & Safety Report is a comprehensive tool designed to provide detailed insights into the quality and safety aspects of construction projects. This report leverages data from various project-level tools within Procore to help construction teams maintain high safety standards and ensure quality control on job sites.
Current Versions
- 2.0 - 25.03.13
Procore Tools Used in the Quality & Safety Report
- Forms
- Incidents
- Inspections (Project level)
- Observations
- Snag List
Report Pages
Quality & Safety Insights
Key Influences
Root Cause Analysis
Incidents
Incident Details
TRIFR Analysis
Observation Insights
Observations
Inspection Insights
Inspection Quality
Inspection Compliance
Inspection Closeout
Inspections
Snag Item Insights
Snag Items
Forms
Forms Compliance
Risk Report
The Analytics Risk Report enables customers to consolidate and manage risk across the Procore platform in a single place. The report identifies leading and lagging risk indicators that drive financial, programme and safety risk.
Current Versions
- 2.0 - 25.03.13
Procore Tools Used in the Risk Report
- RFIs
- Submittals
- Correspondence
- Site Diaries (Manpower and Notes)
- Observations
- Incidents
- Inspections
- Snag List
- Main Contracts
- Commitments
Report Pages
Risk Summary
Risk Register
Probability Matrix
Project Risk Matrix
Risk Map
Budget Risk
Risk Types
Data Quality Issues
Configuration
Resource Management Report
The Analytics Resource Management Report is a tailored analytics tool designed specifically for speciality contractors to provide detailed insights into their specific areas of work within construction projects. This report leverages data from various Procore tools to offer a comprehensive view of performance, productivity, financial health, compliance and resources, helping speciality contractors manage their operations more effectively.
Prerequisites
In order for the Resource Management Report to function properly, budgeted production quantities must be added to the project's budget and quantities must be added to the project's timesheets. See Add Budgeted Production Quantities to a Project's Budget and Add Quantities to a Timesheet.
Procore Tools Used in the Resource Management Report
-
Resource Planning
Report Pages
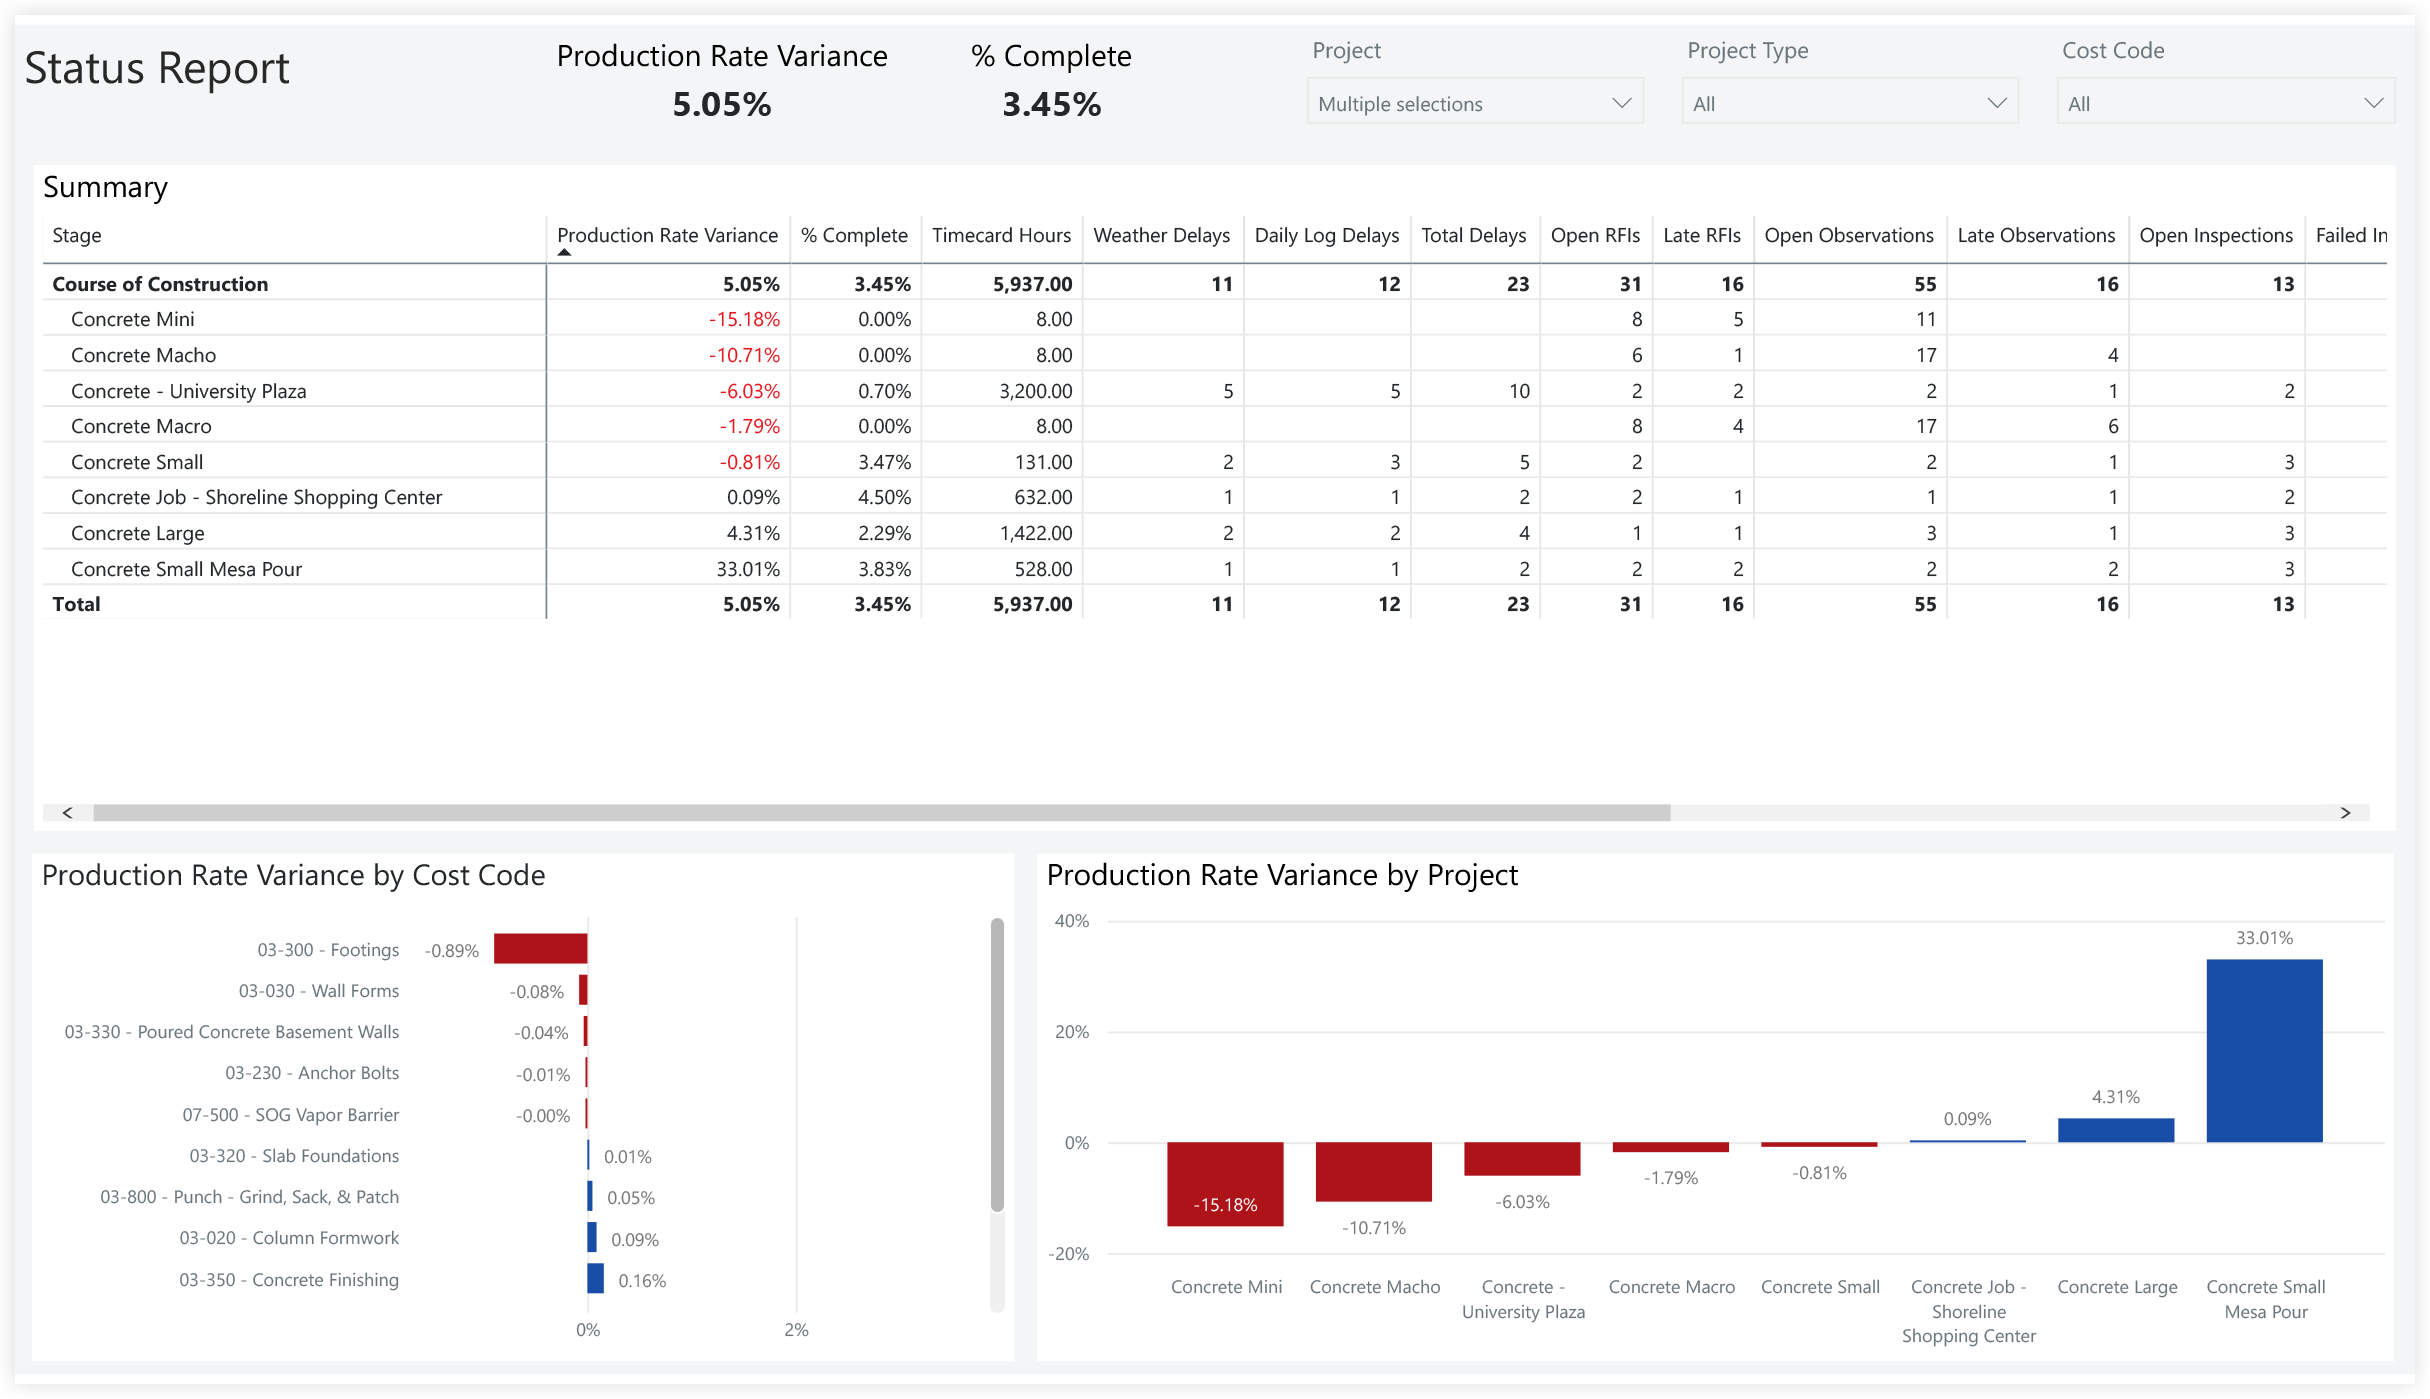
Status Report
Insights
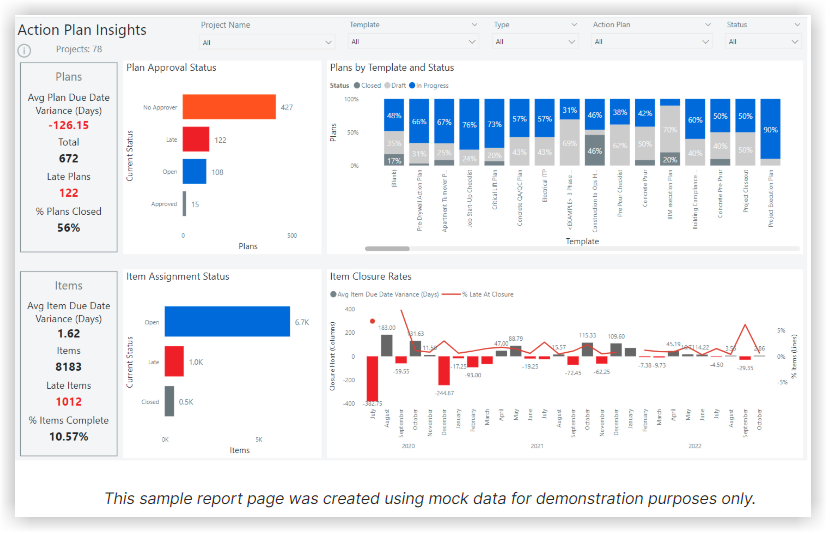
The Action Plans Insights report page offers a variety of visuals that deliver insights into Action Plans data, including details on Plan Approval Status, Item Assignment Status and more.
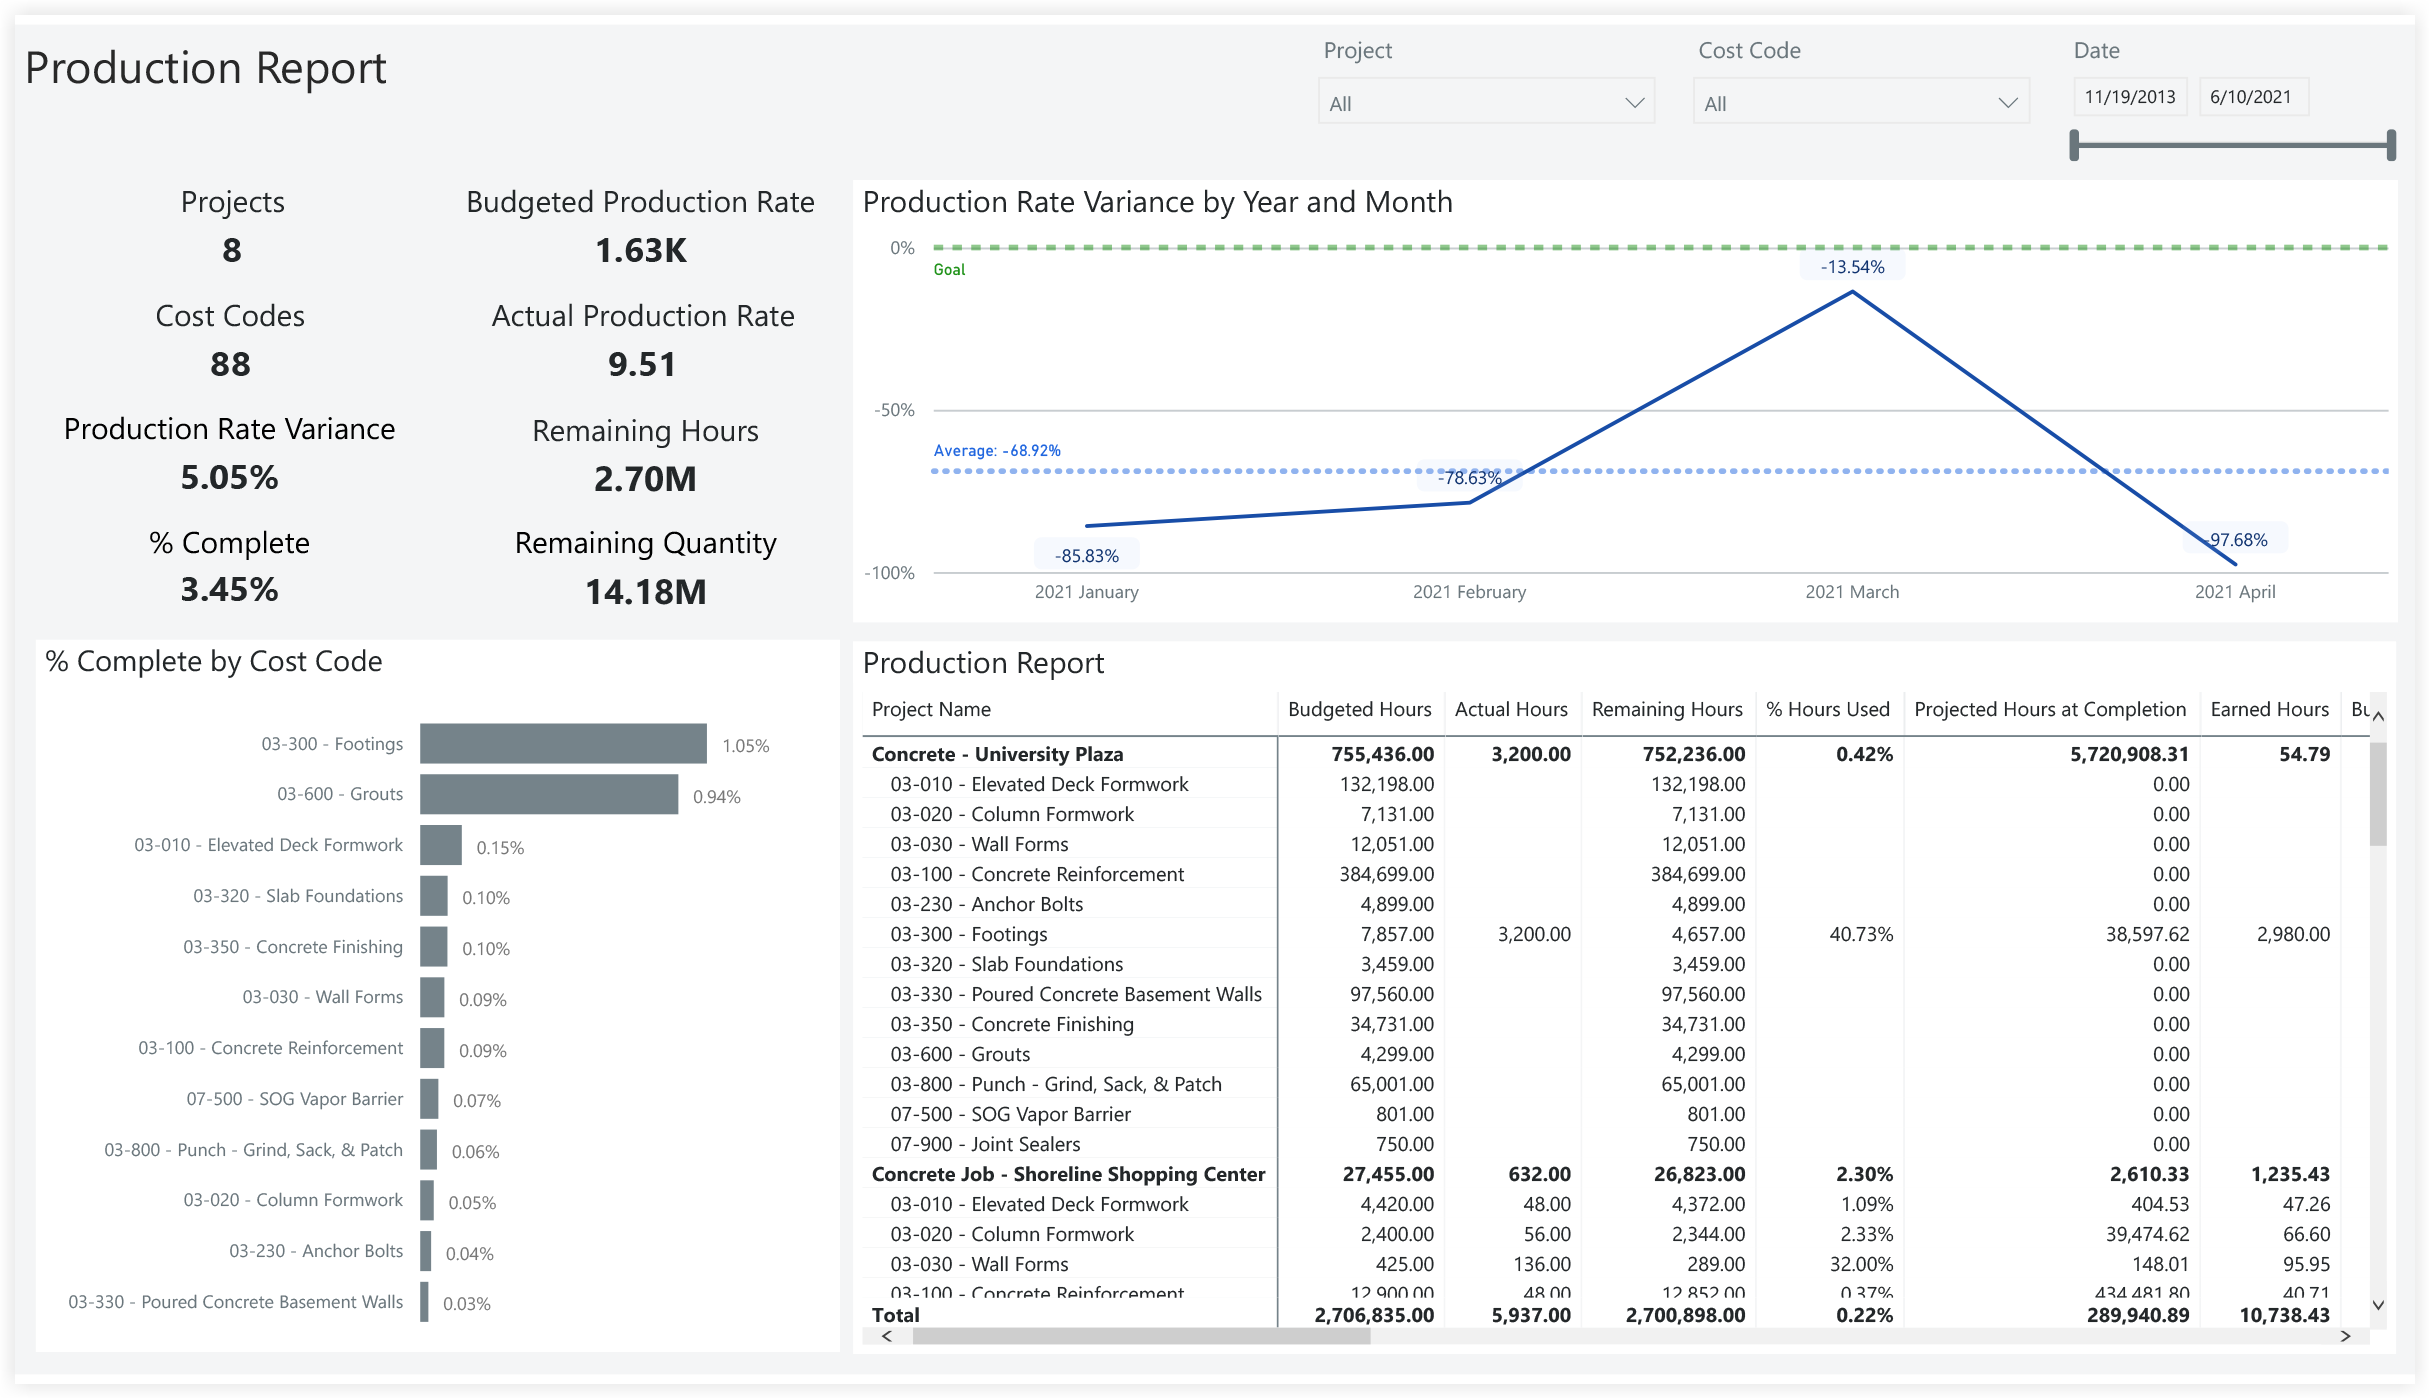
Production Report
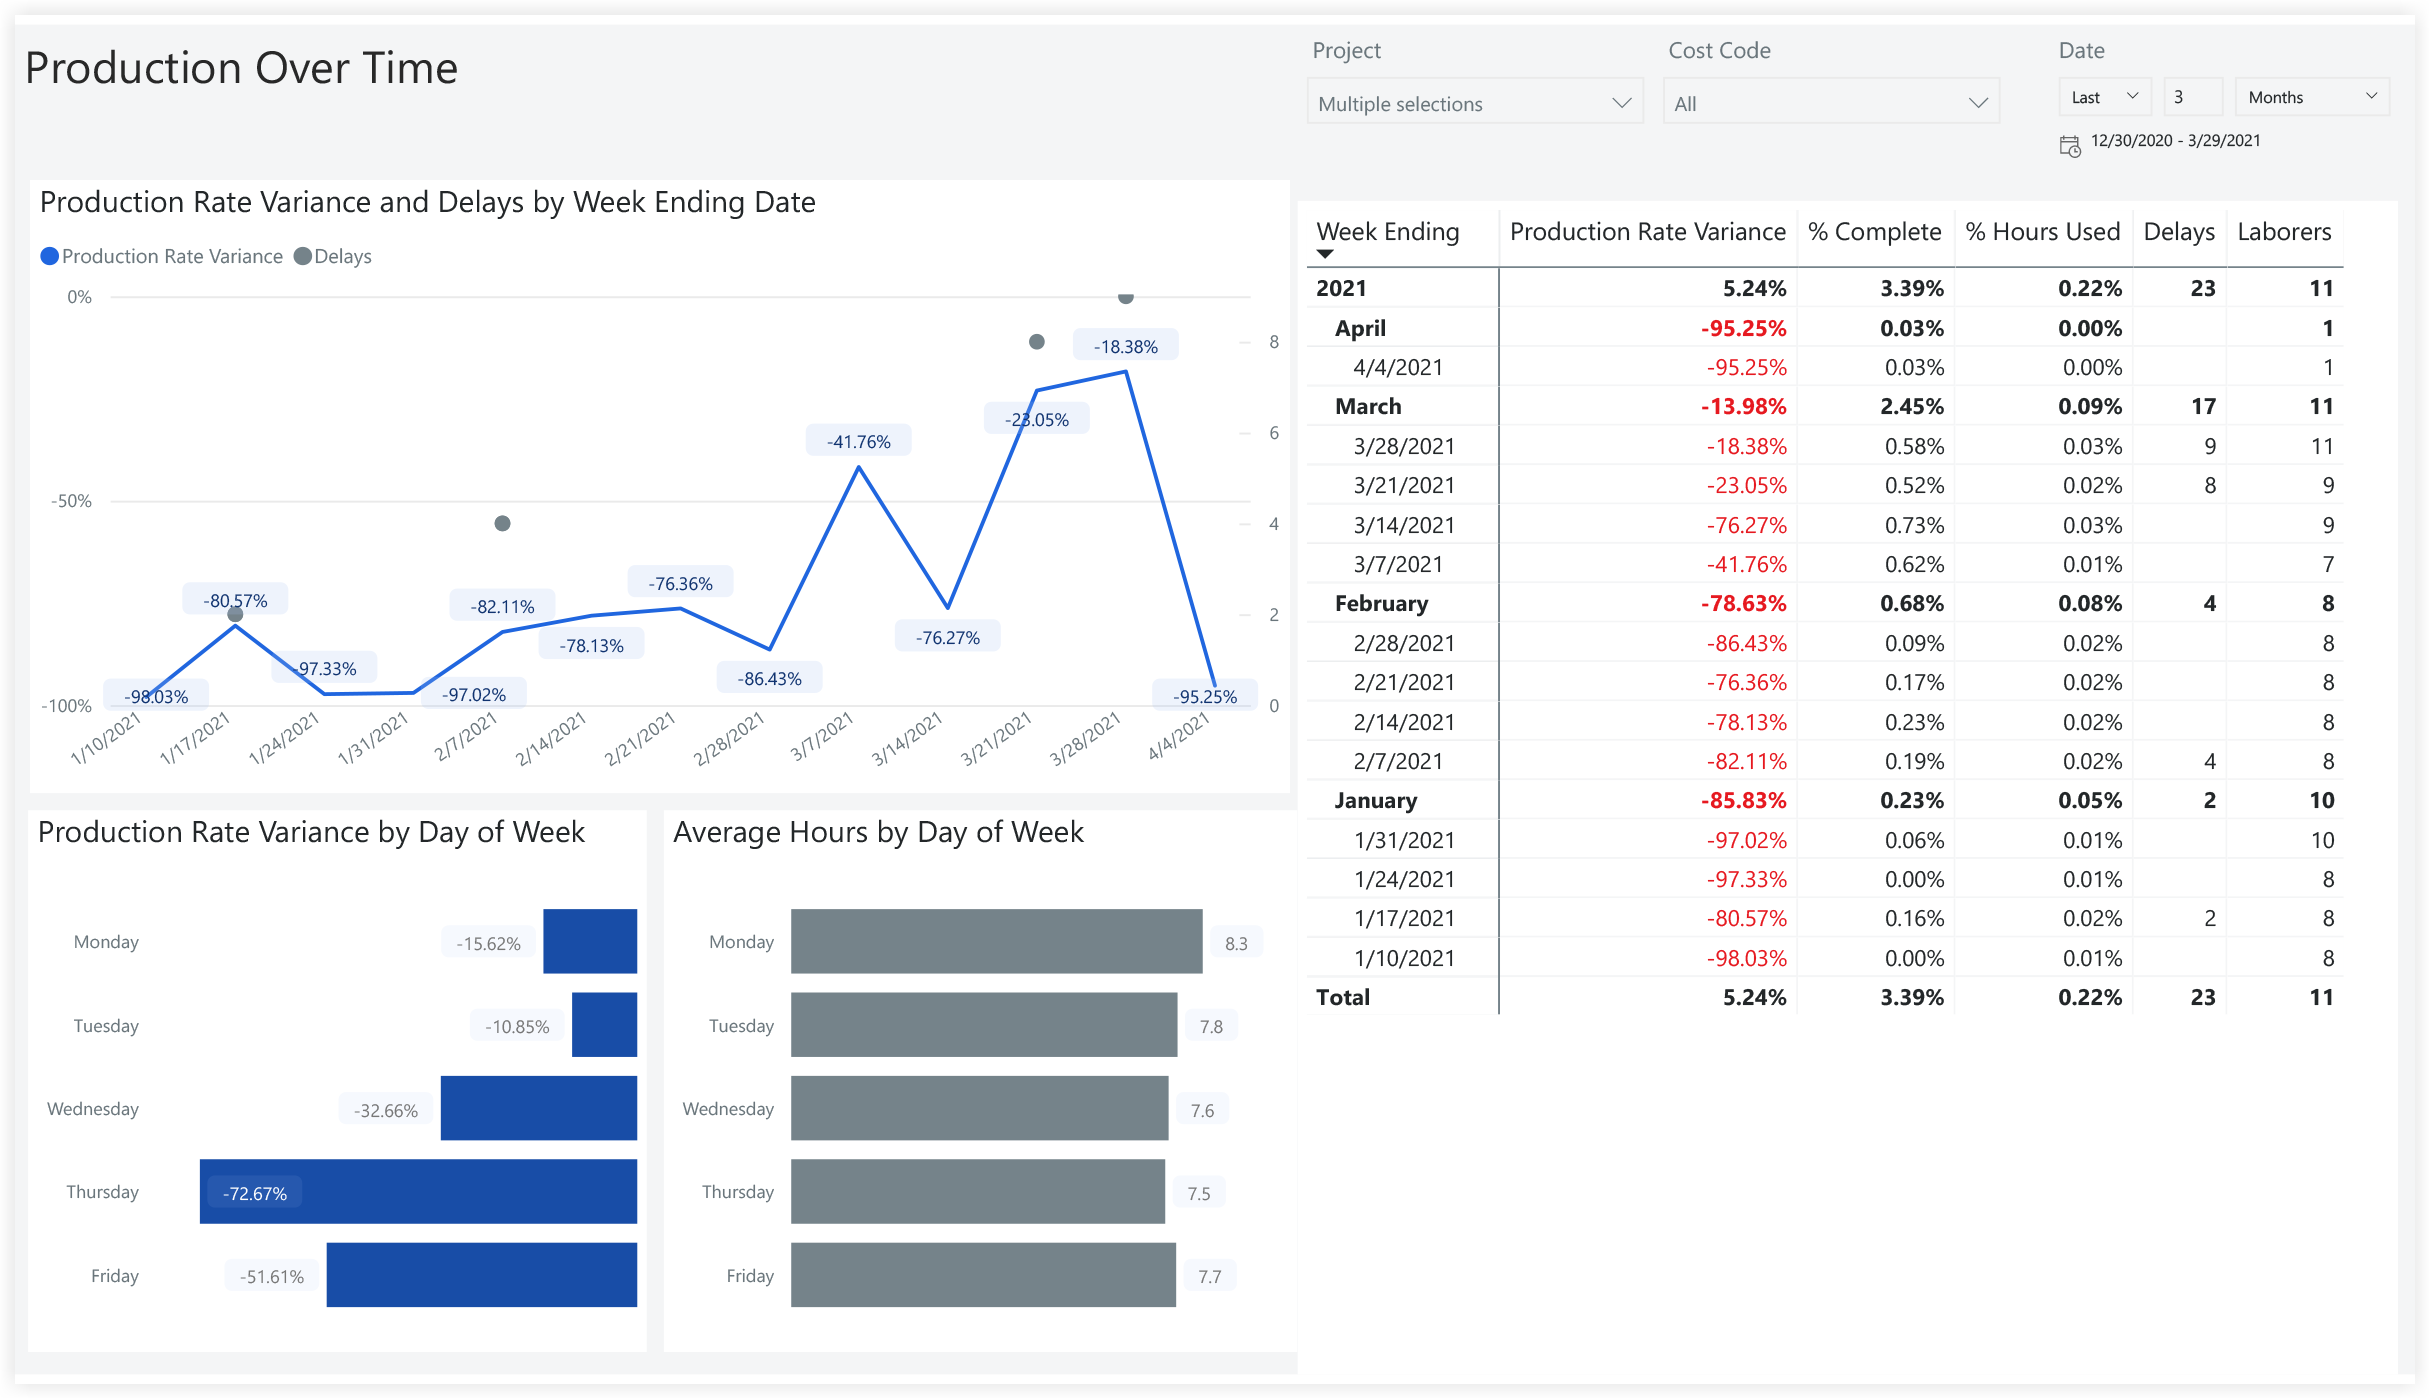
Production Overtime
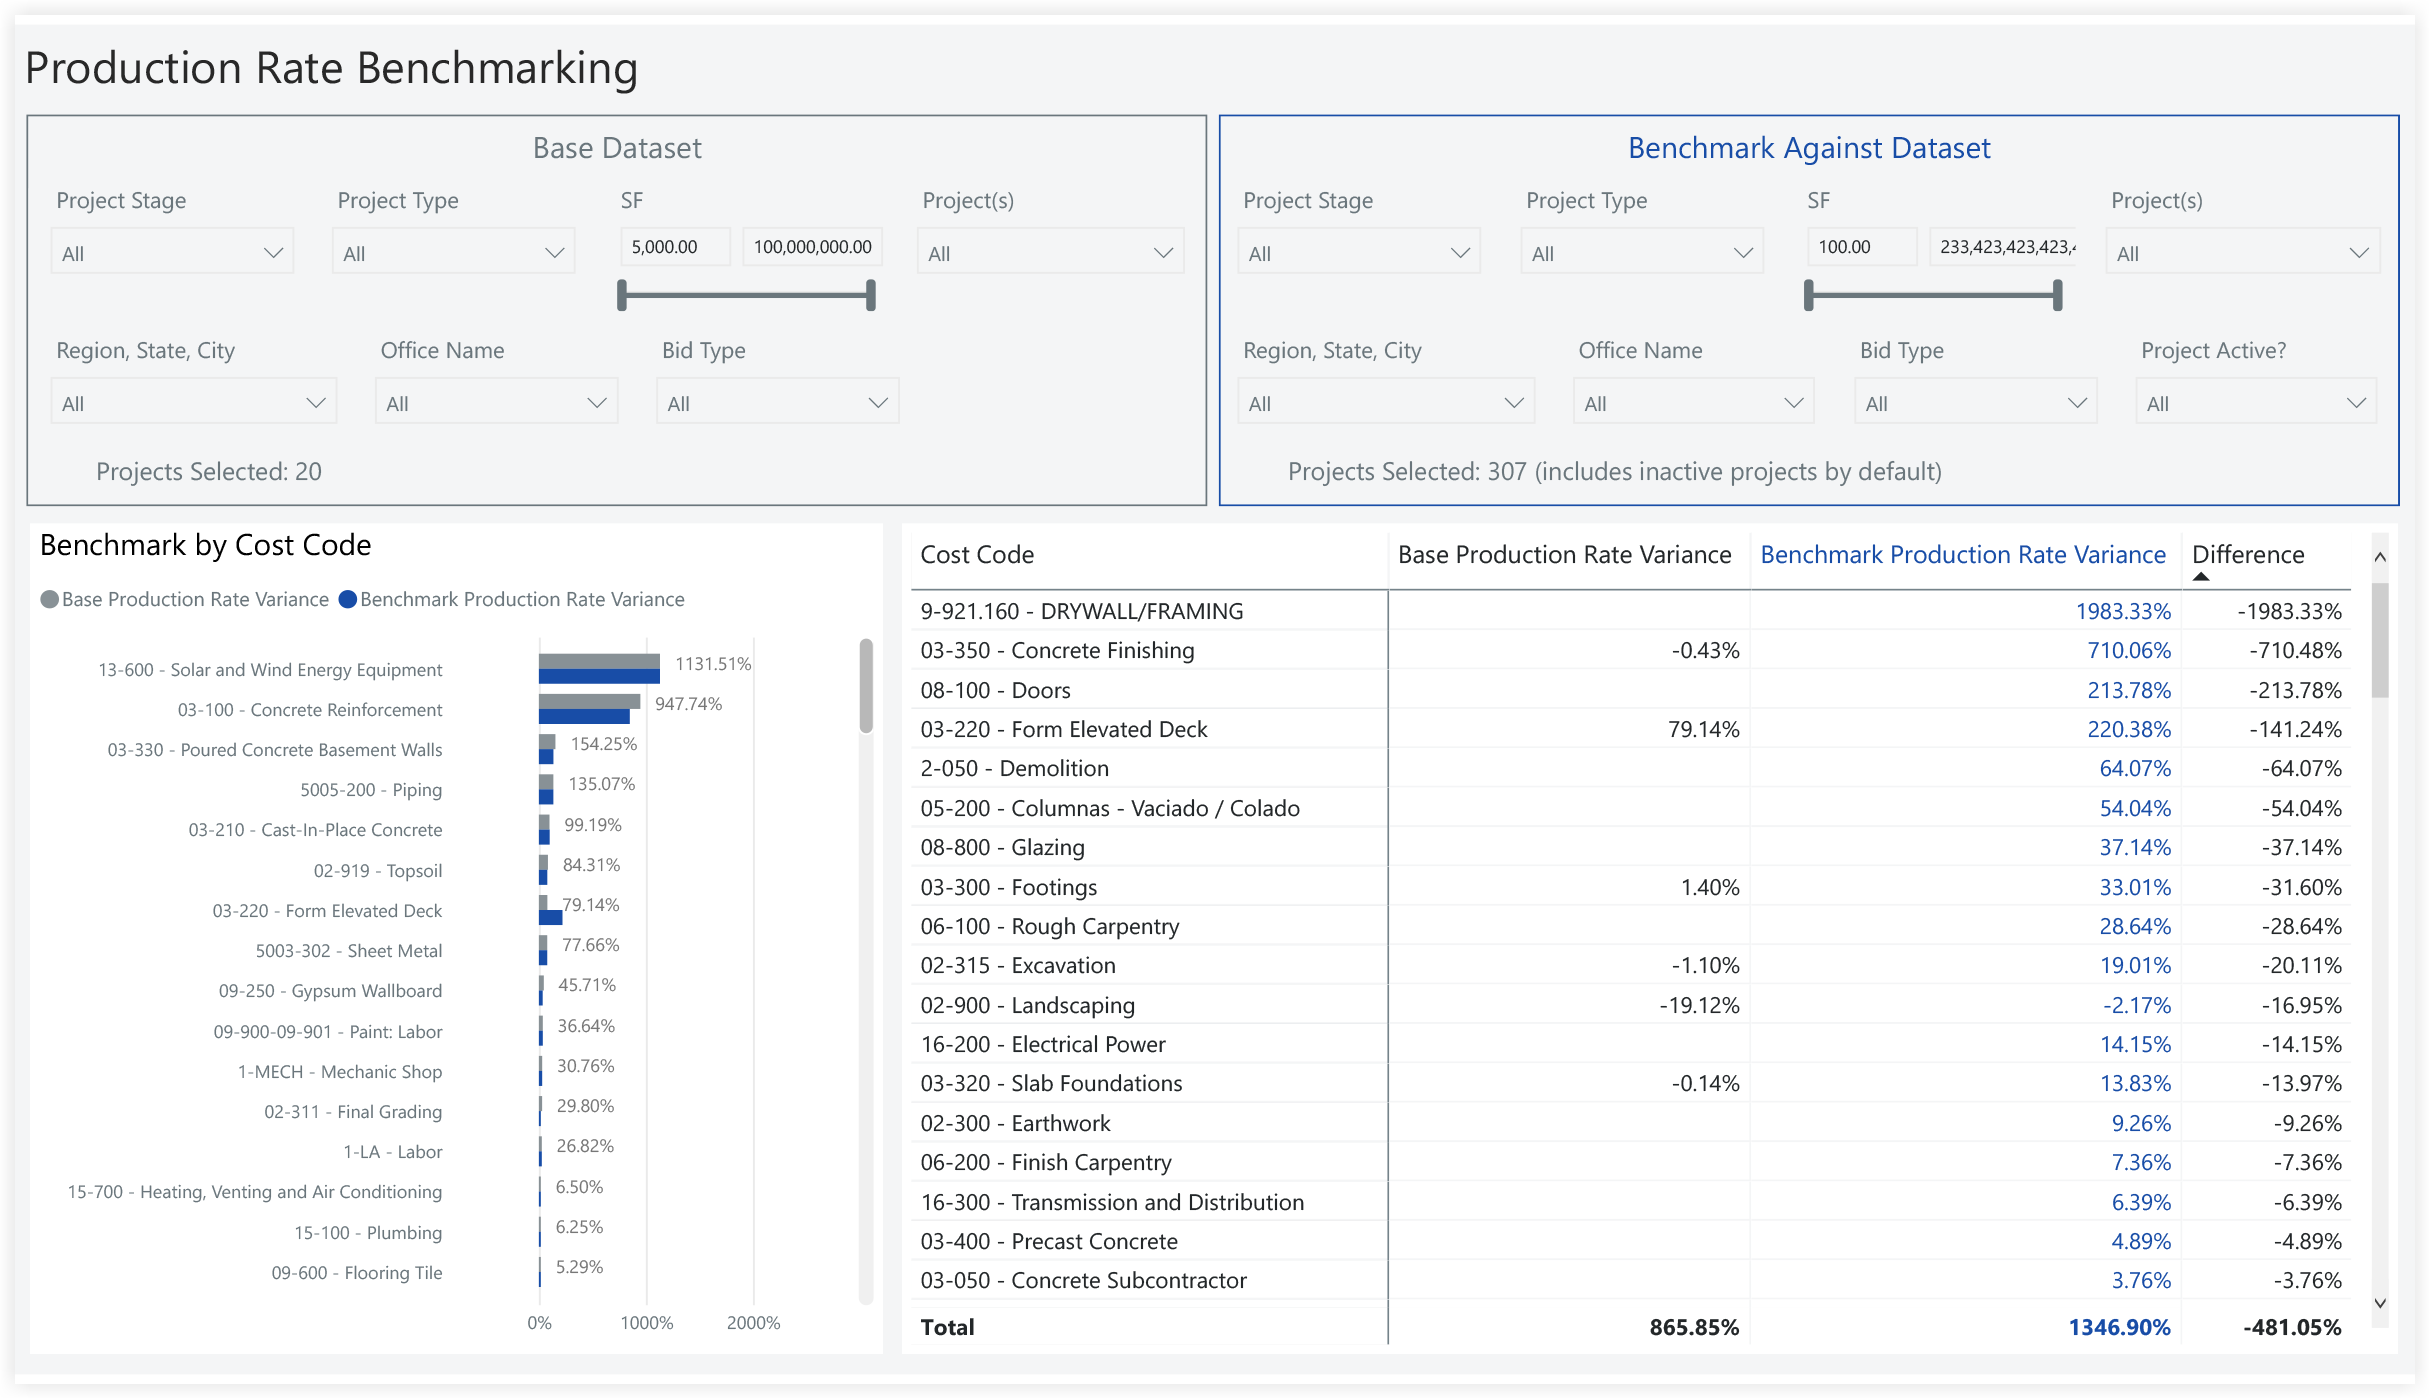
Production Rate Benchmarking
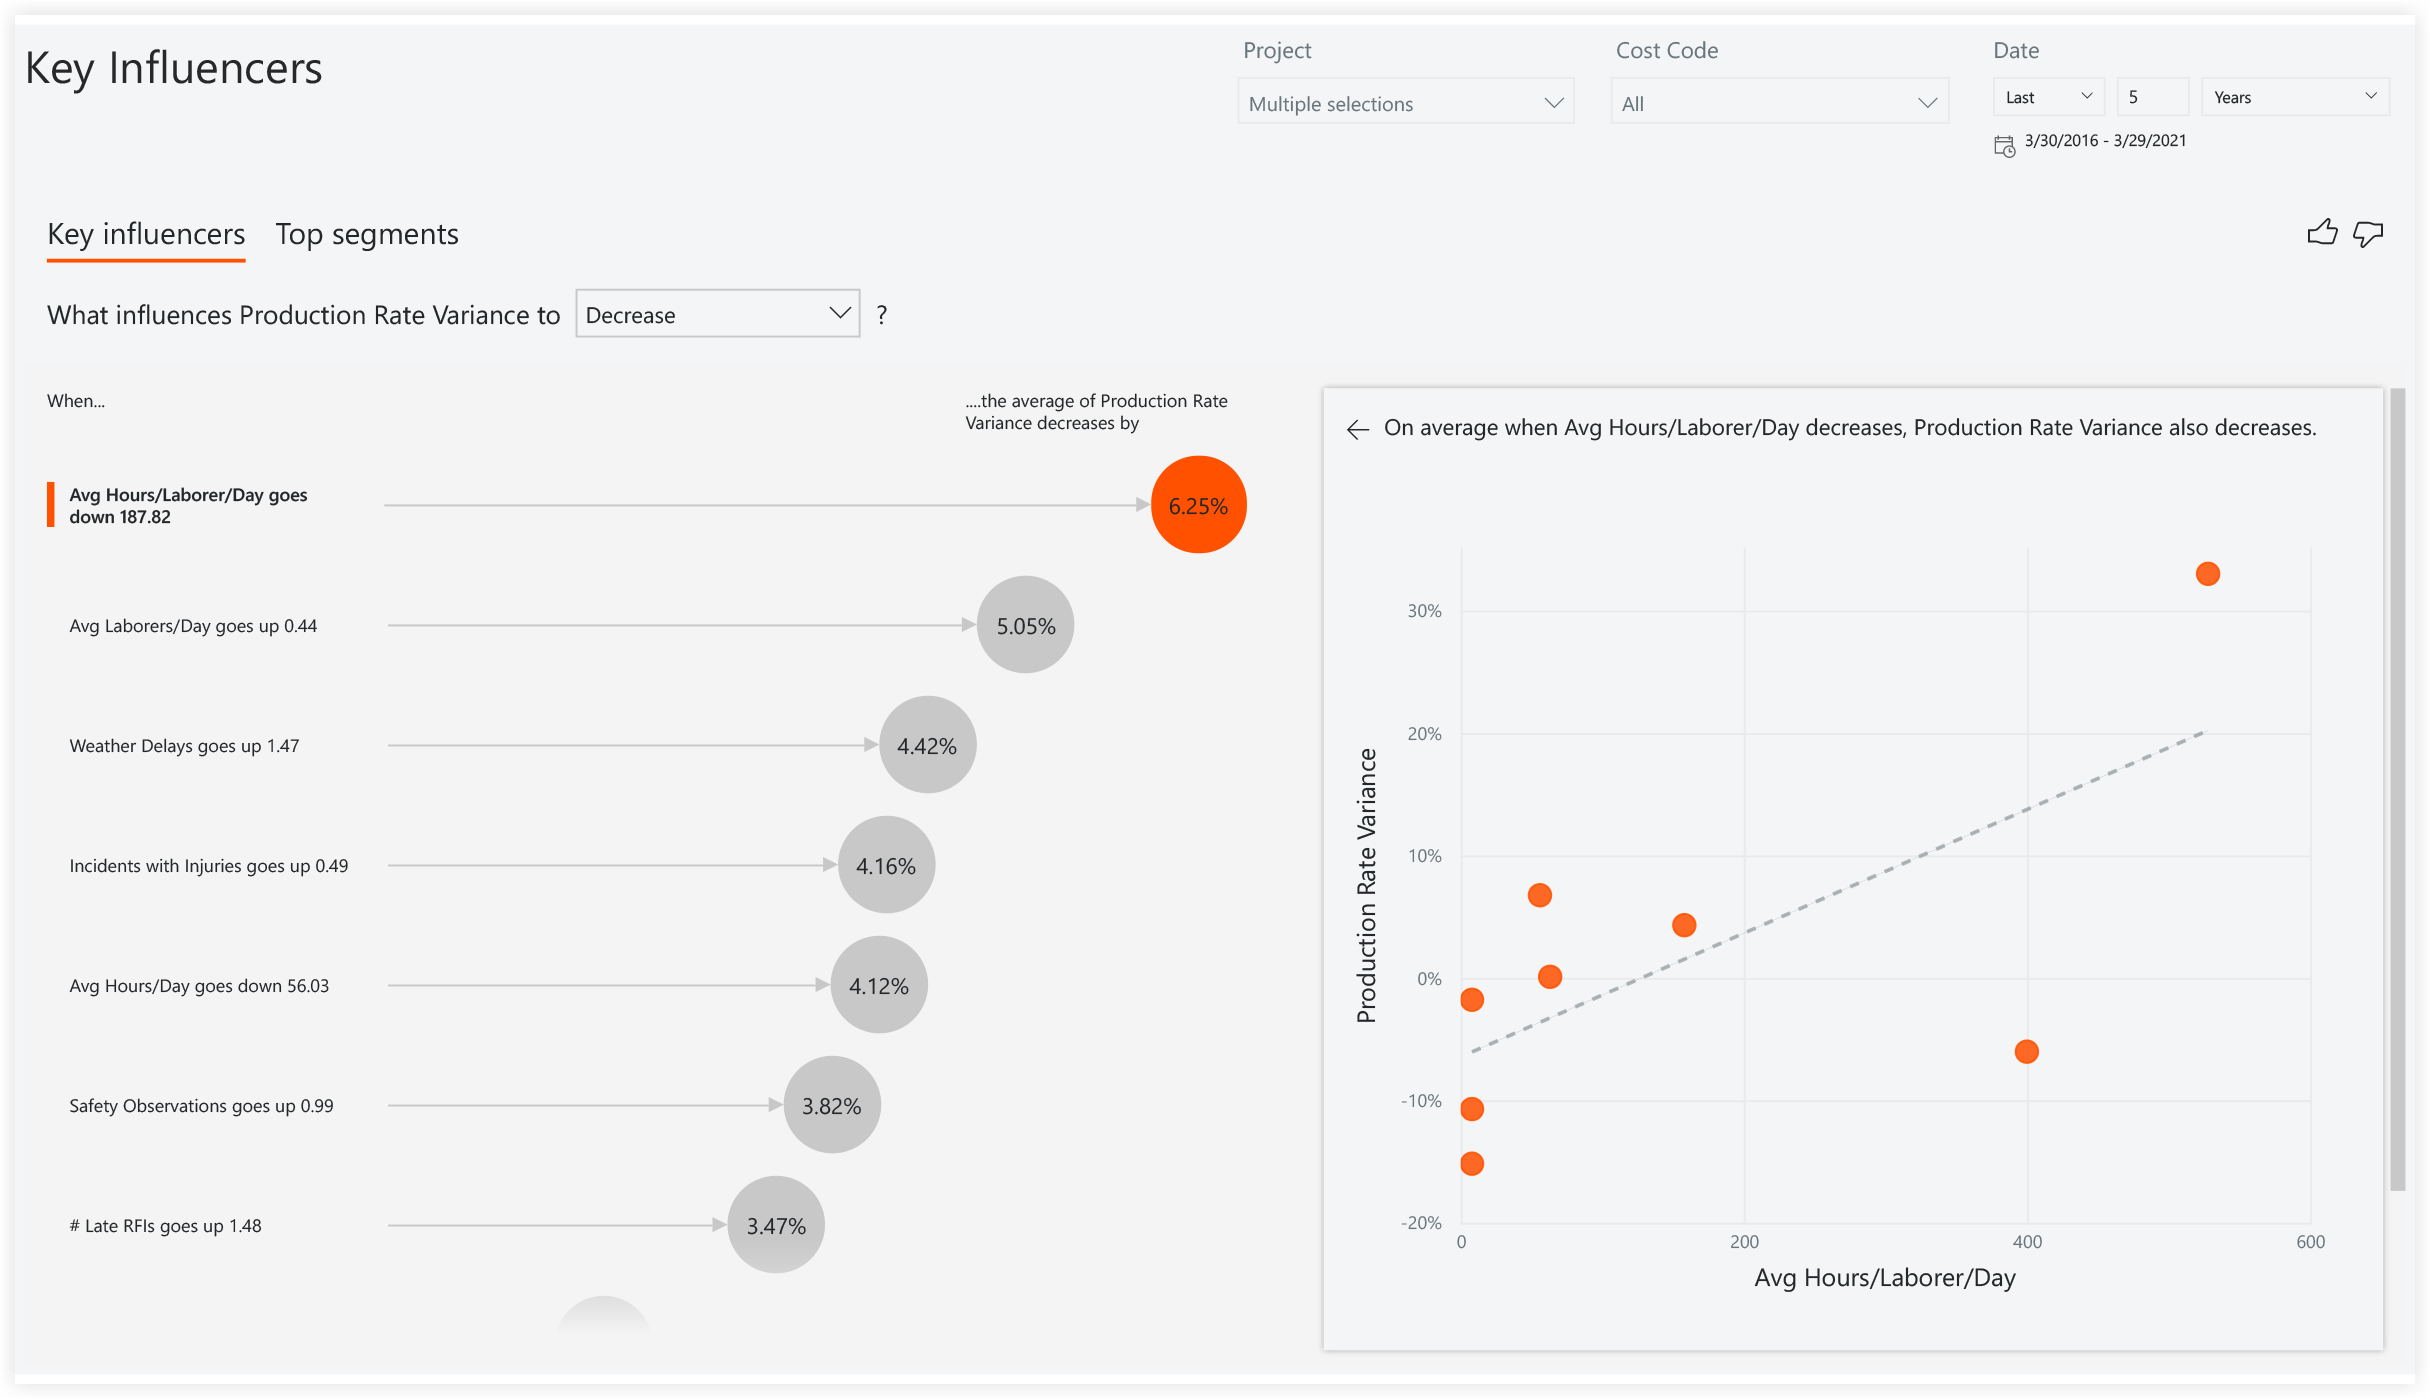
Key Influencers
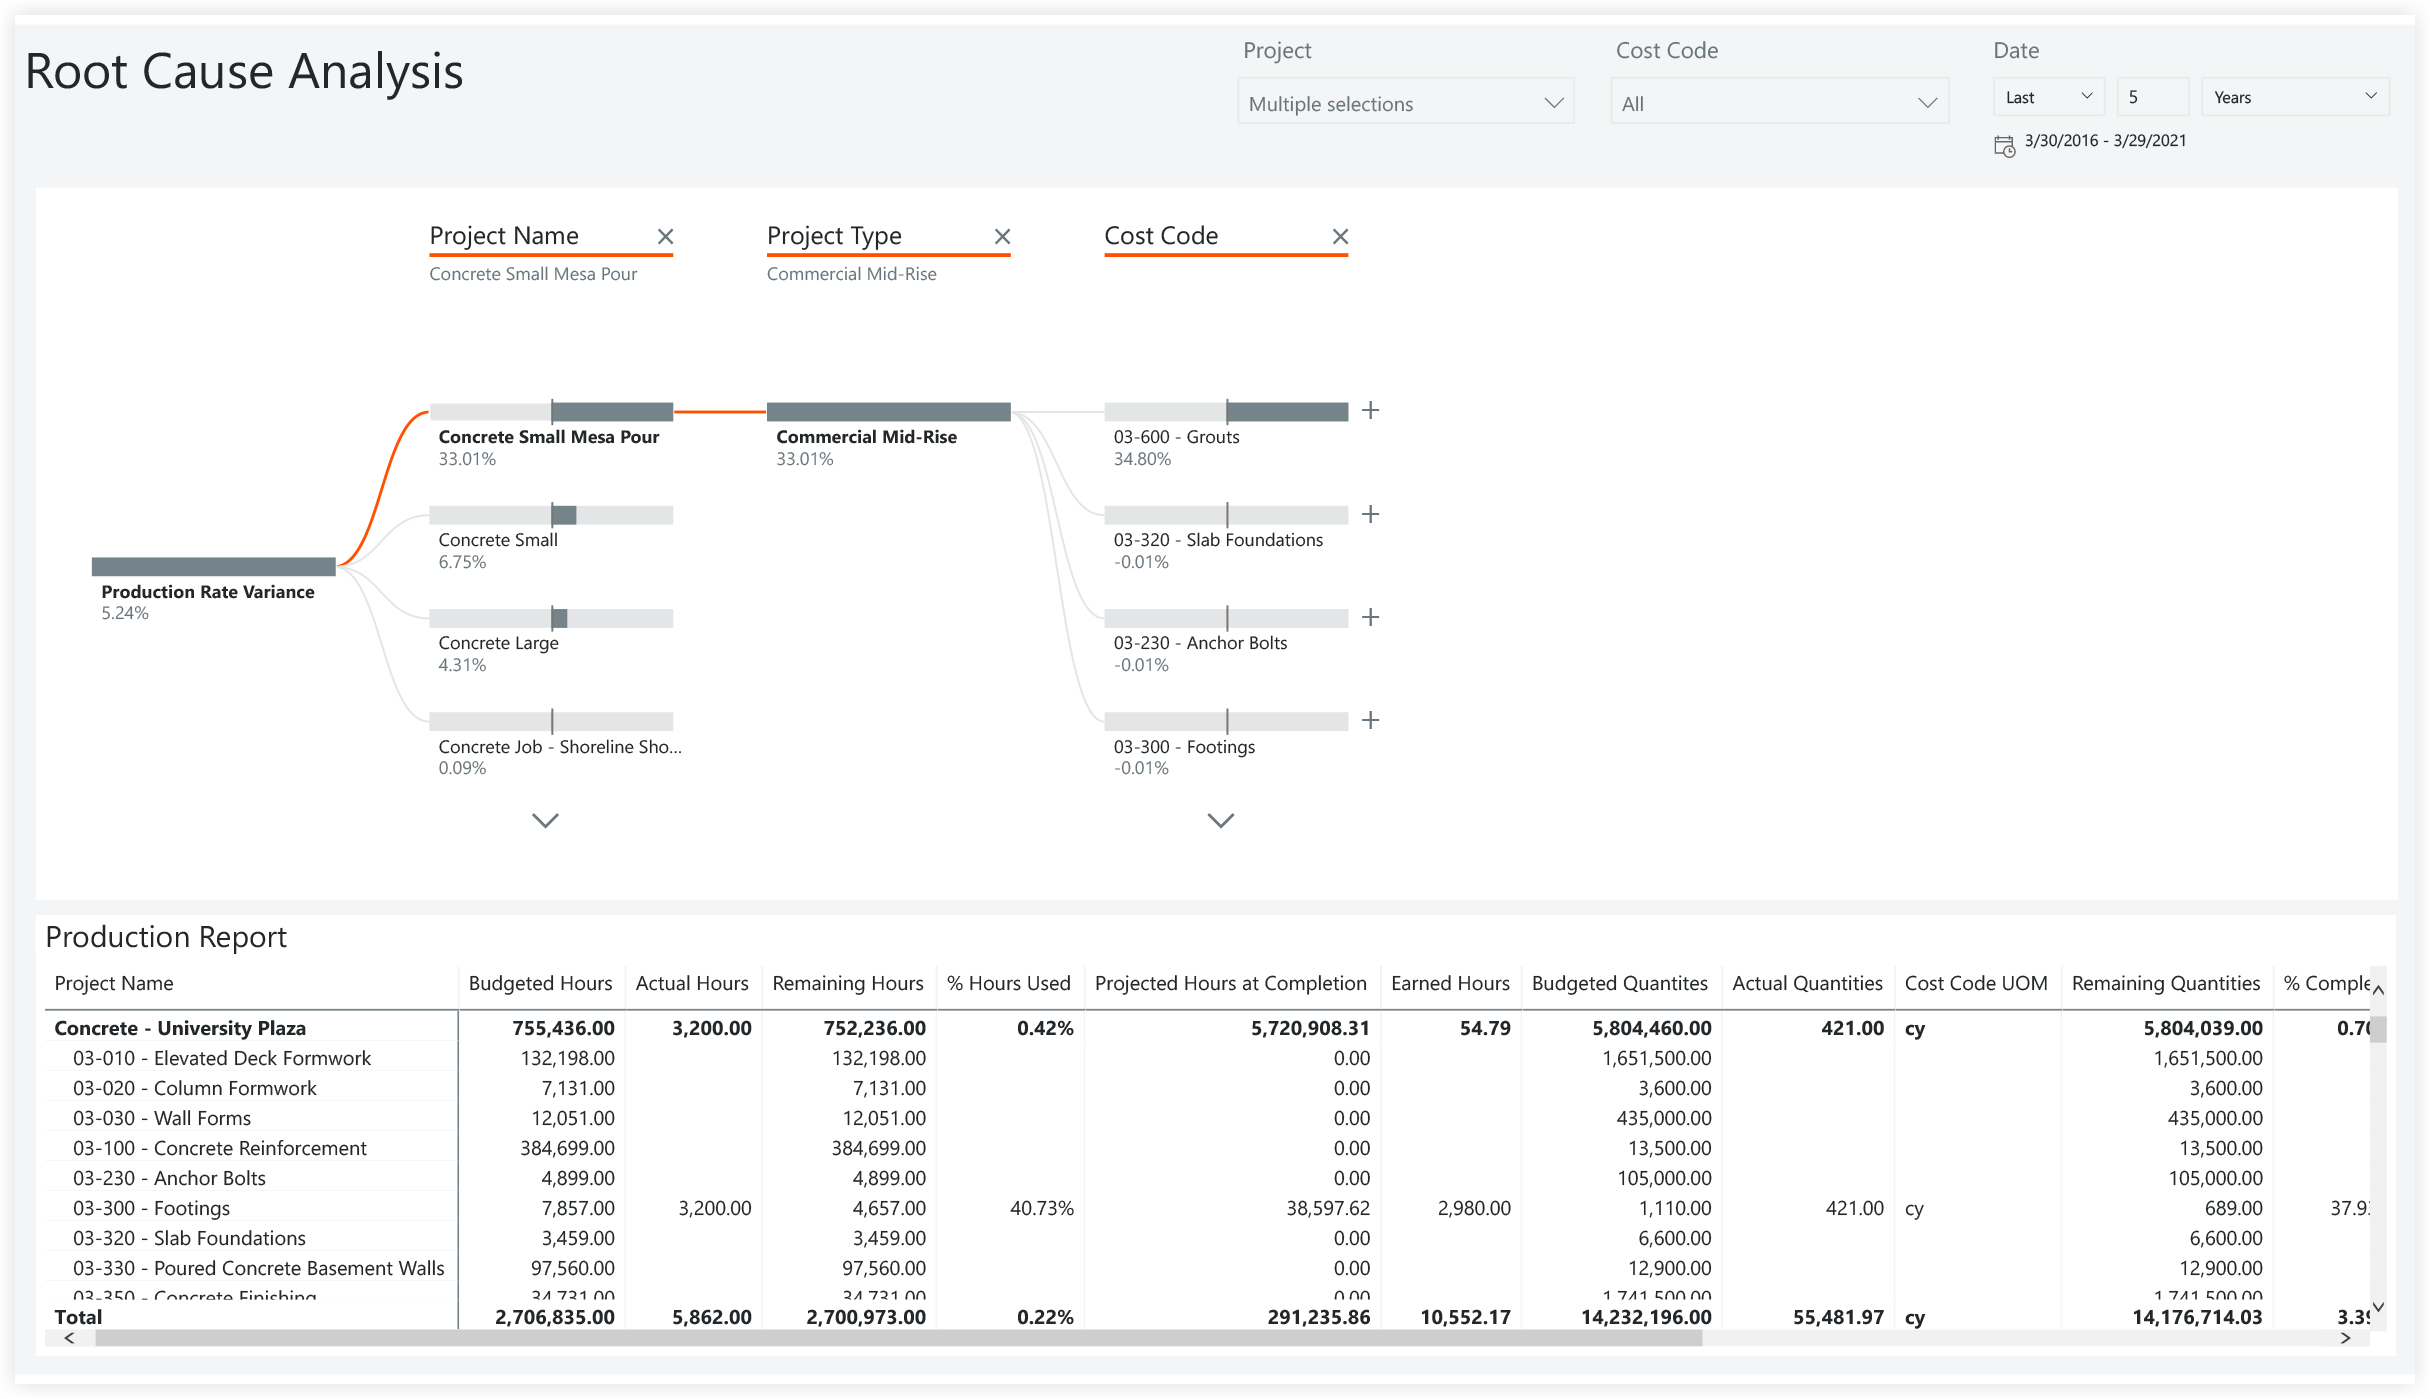
Root Cause Analysis
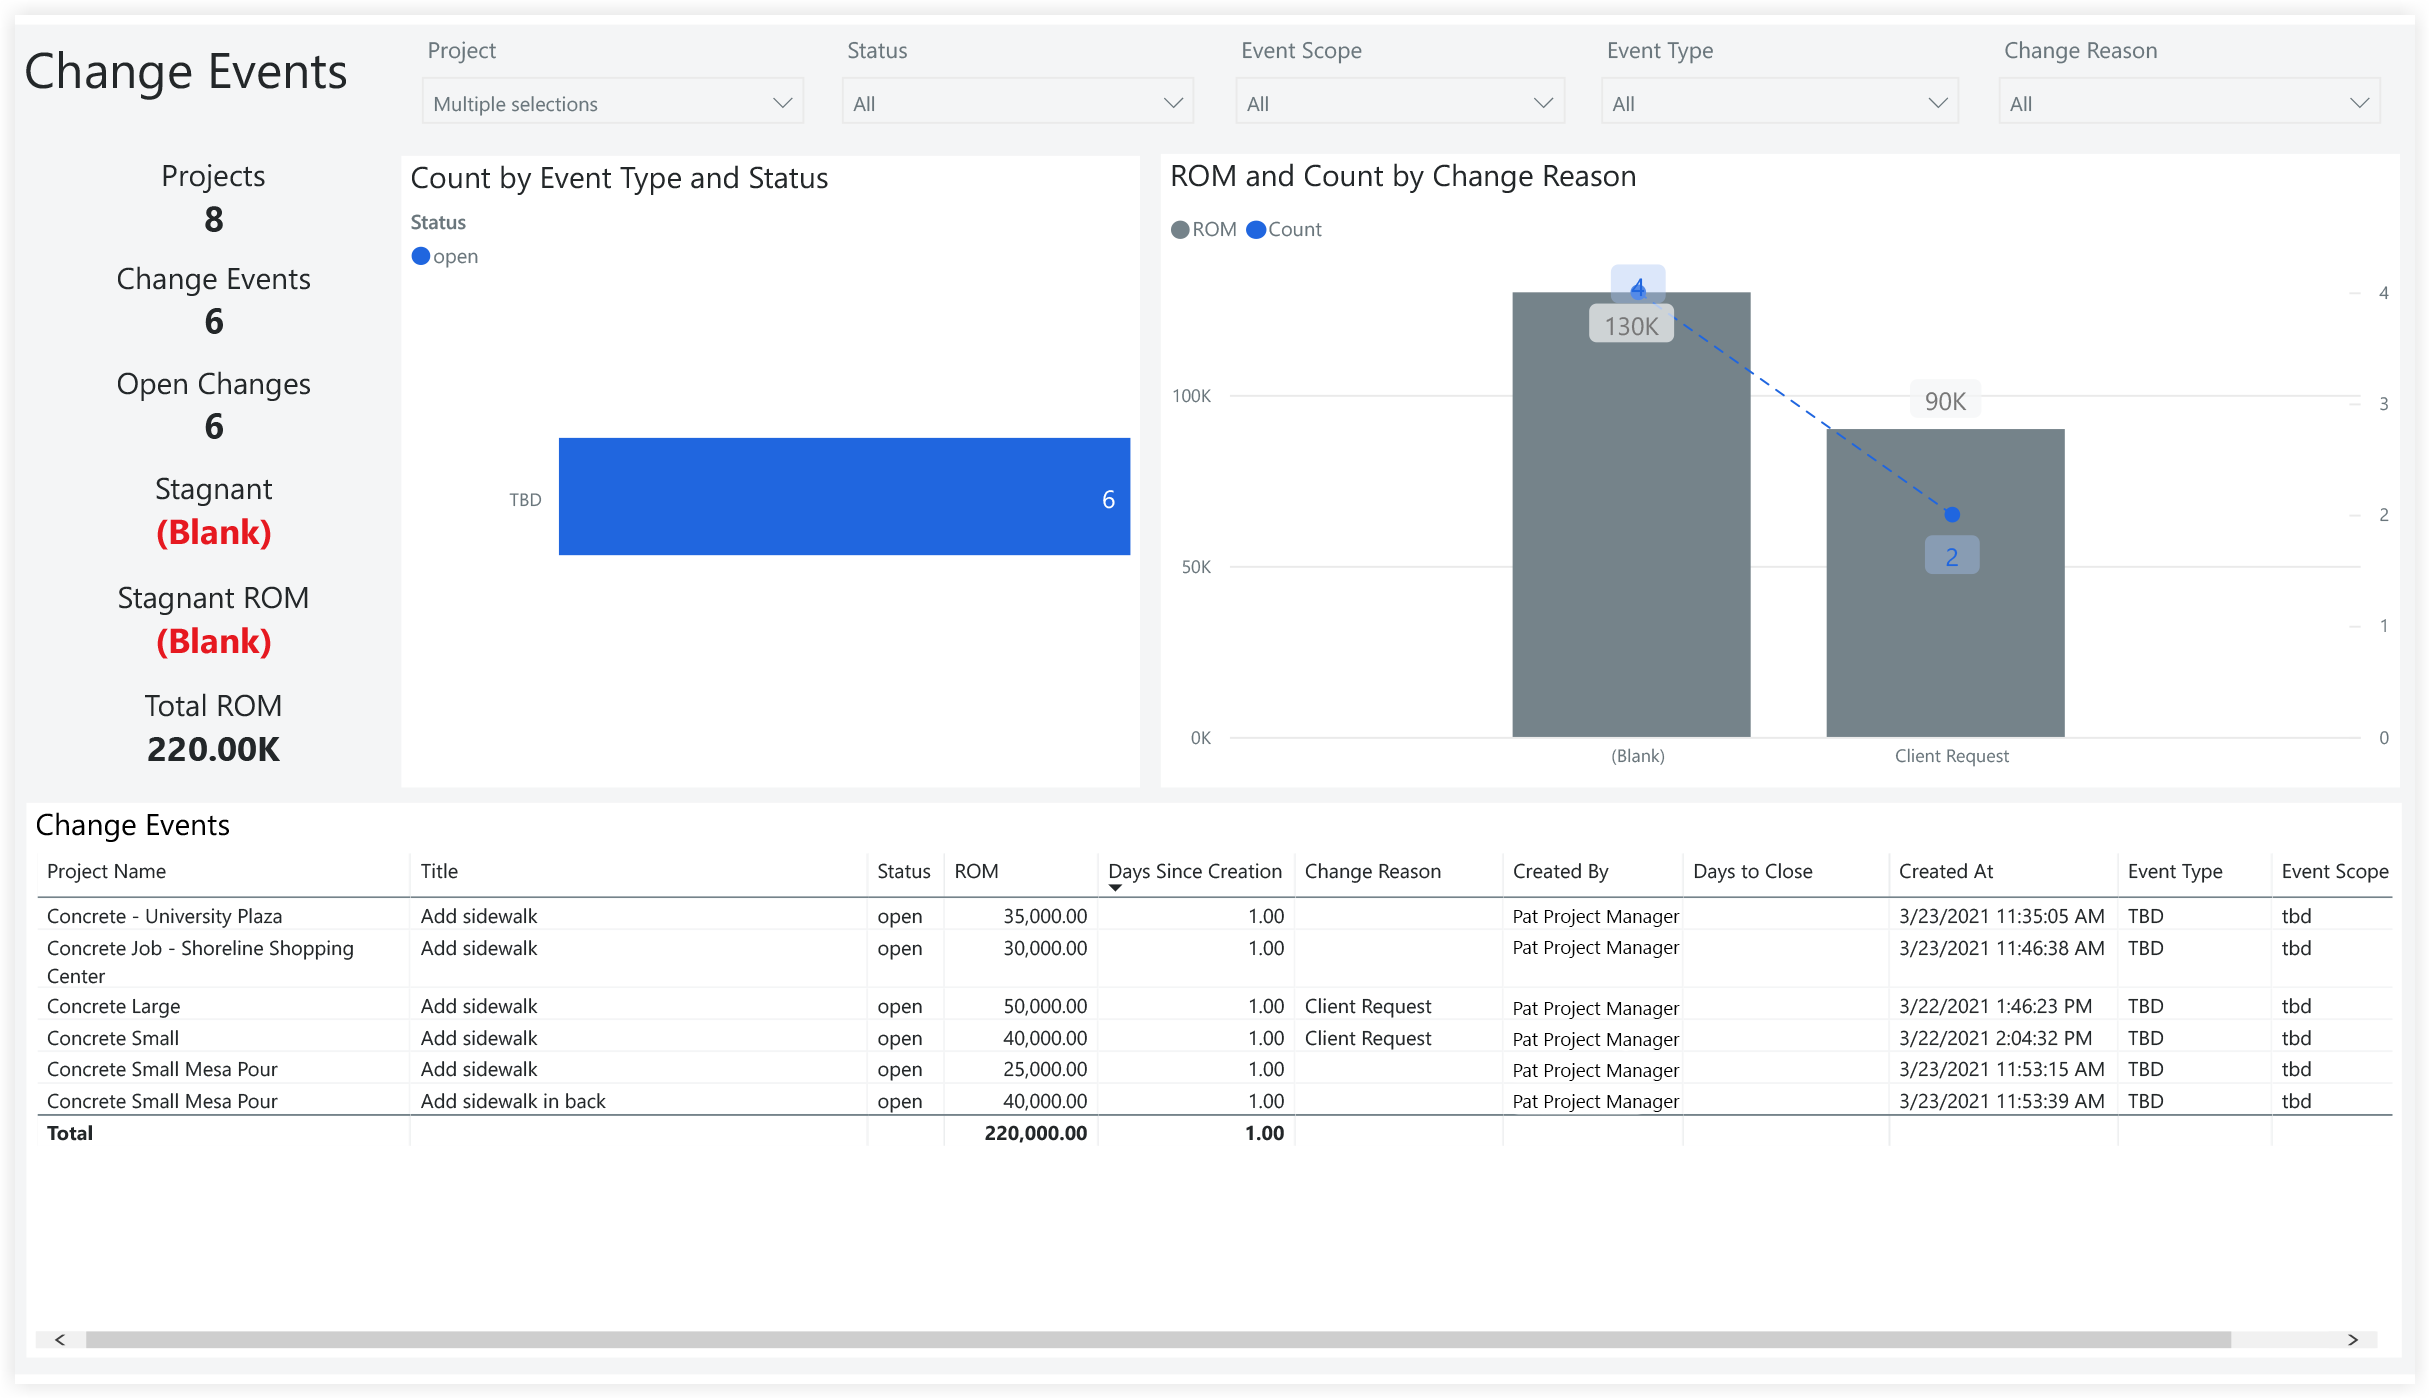
Change Events
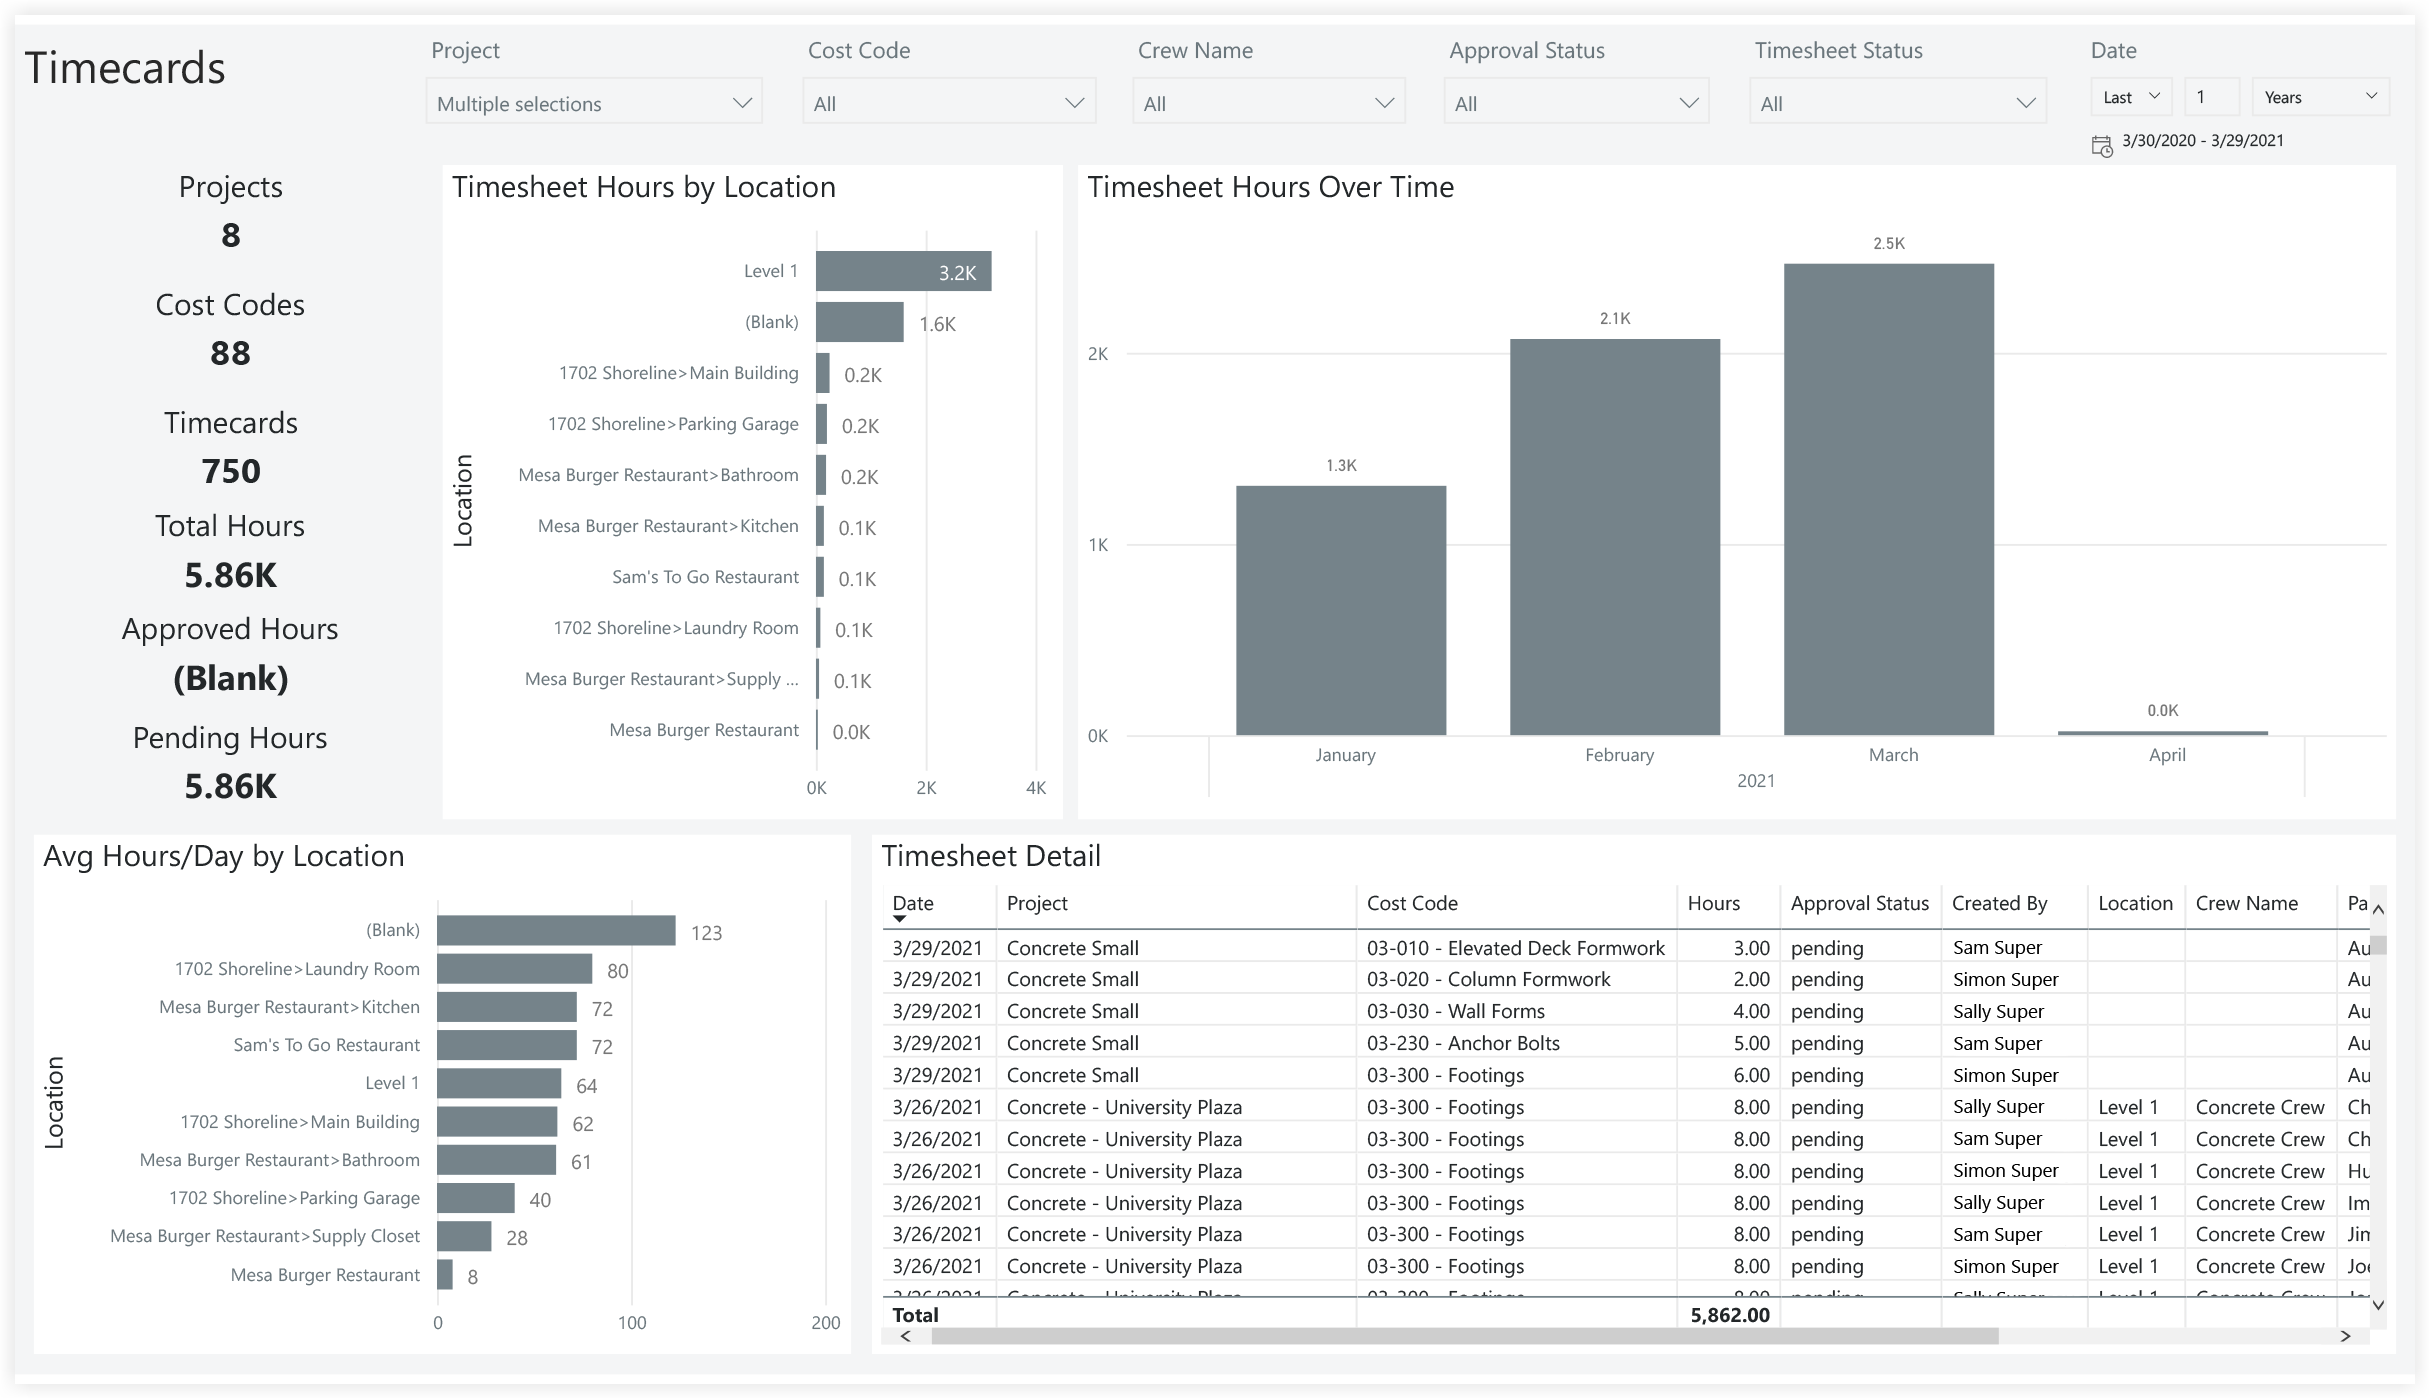
Timecards
Quantities
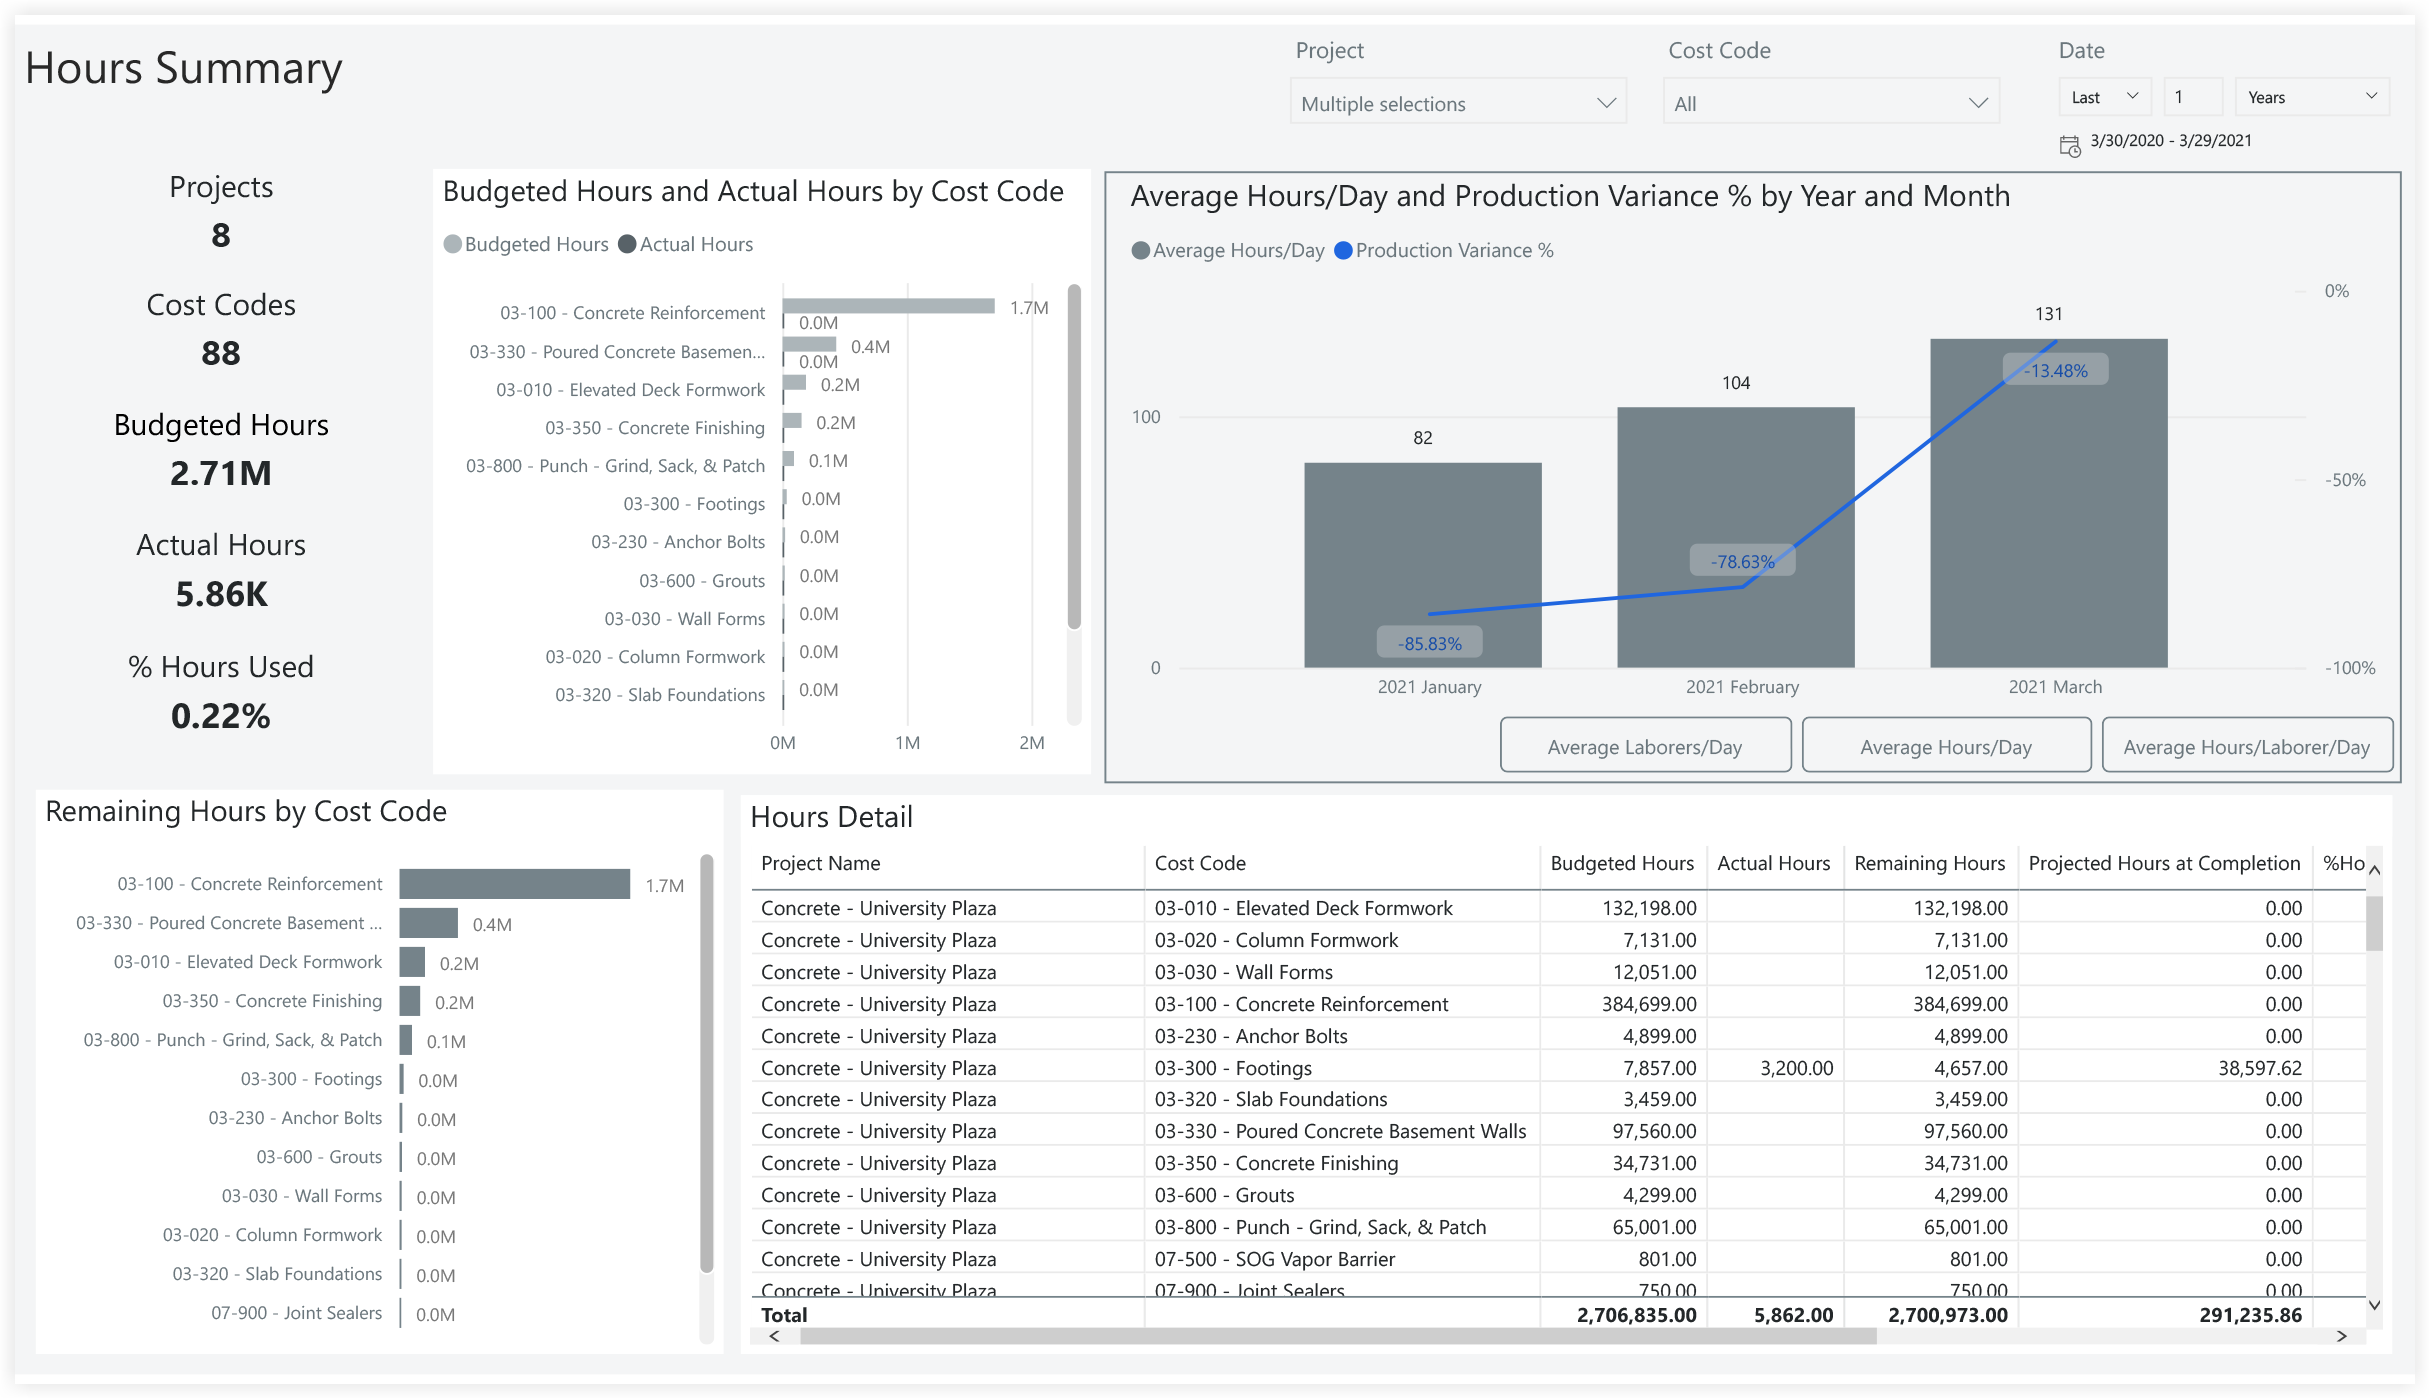
Hours
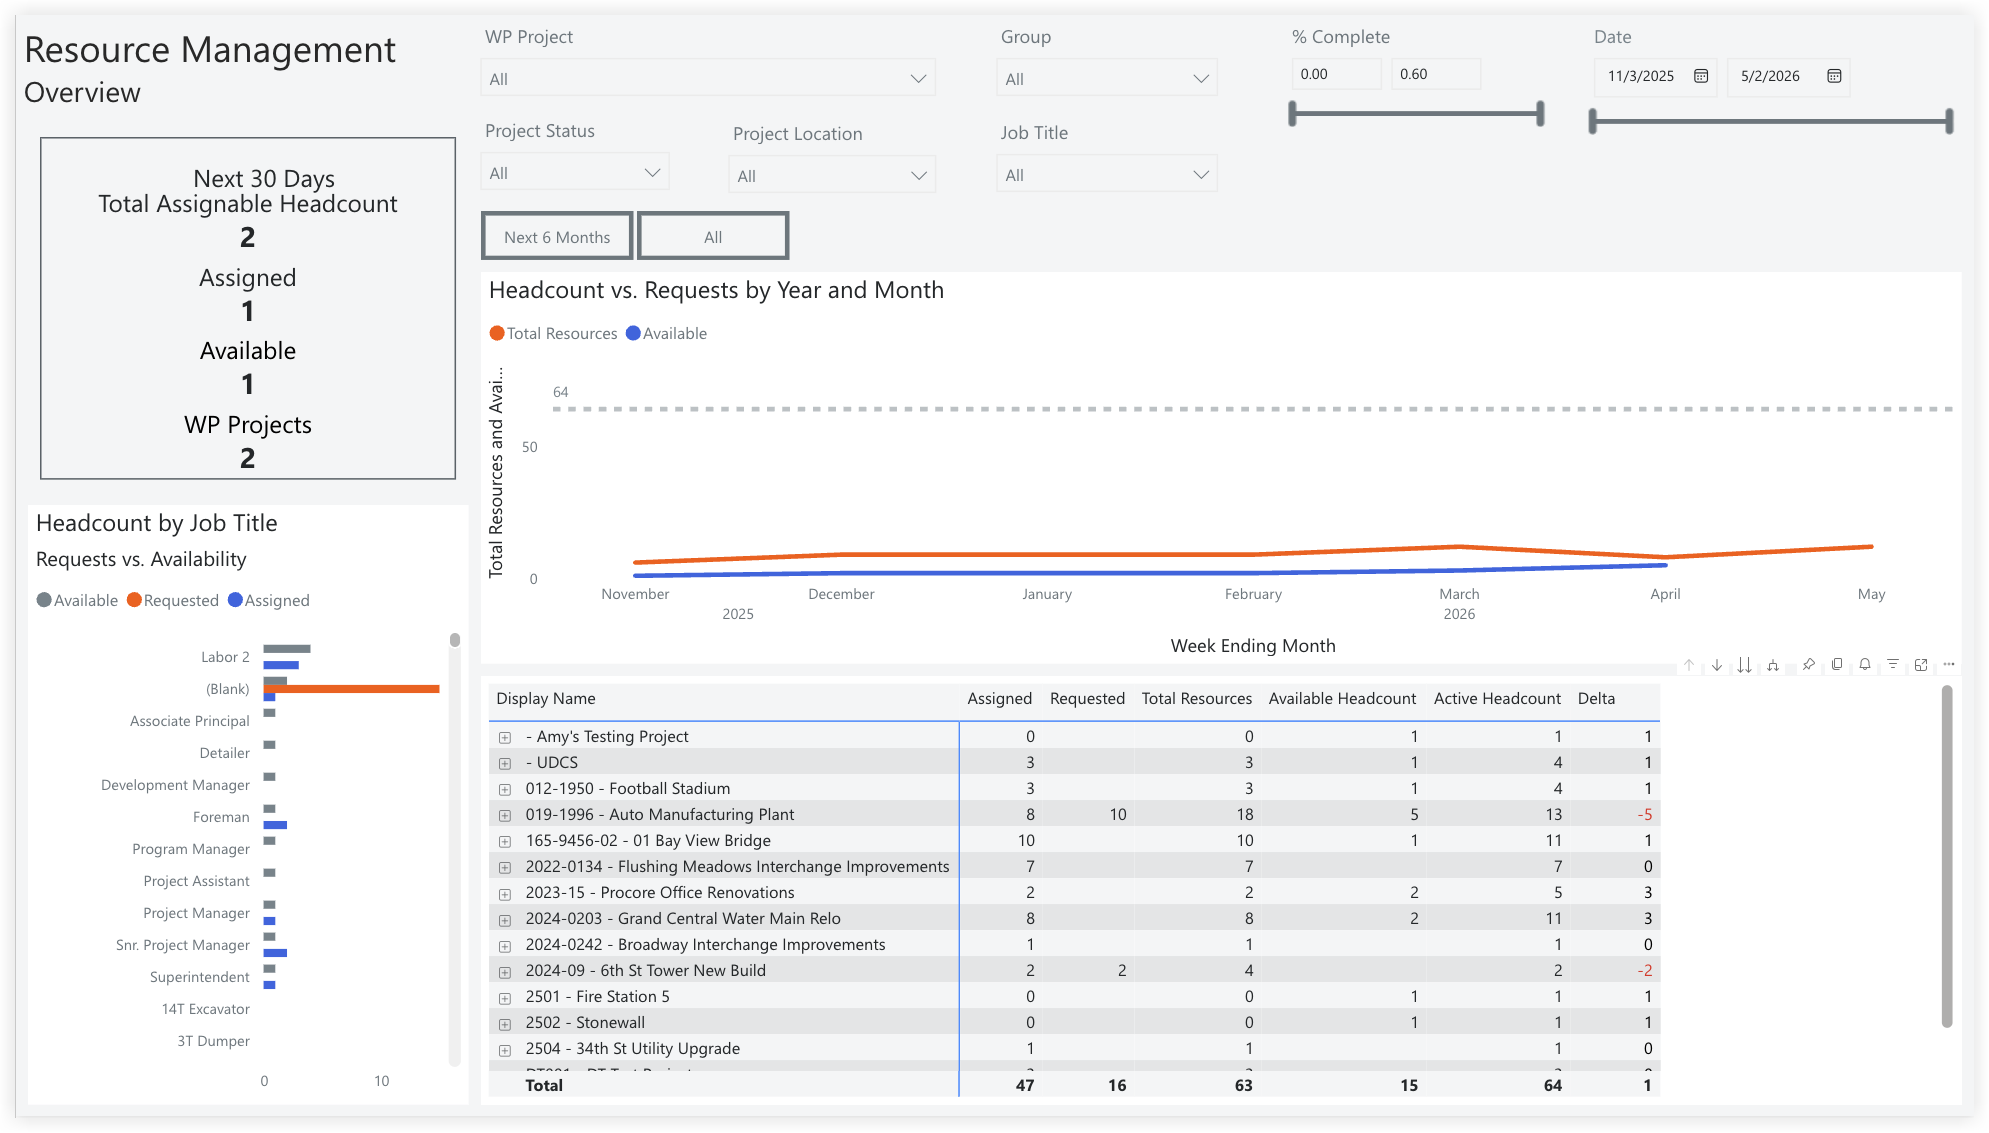
Resource Management Overview
The Resource Management Overview report page provides a quick, actionable overview of immediate resource capacity and future demand across all projects. It tracks your Total Available Headcount versus current assignments, alerting you instantly to project-specific staffing shortfalls (Delta). Use this report page to proactively manage staffing levels and ensure critical roles are filled.
Planned vs. Actuals
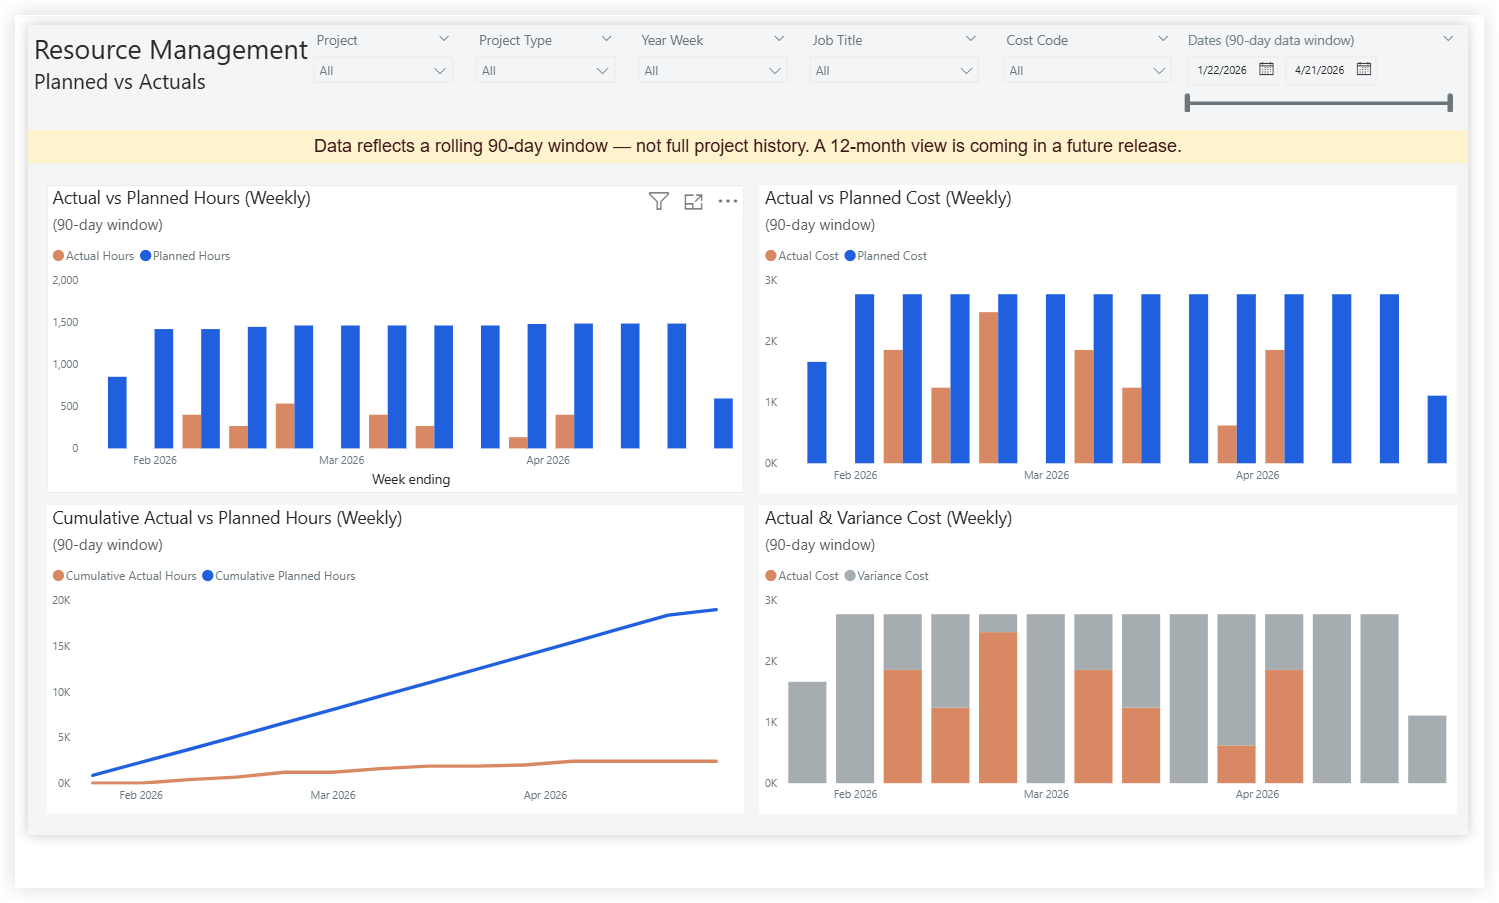
The Planned vs. Actuals report page provides Resource Management teams with a week-by-week comparison of forecasted resourcing against actual project allocations over a rolling 90-day window. The page displays planned versus actual hours and planned versus actual cost side by side, along with a cumulative trendline and a variance breakdown. It helps resource managers and project leaders quickly identify where crews are under- or over-utilised, where cost is drifting from plan and how the gap between planned and actual effort is trending over time.
Note
-
Data reflects a rolling 90-day window, not the entire project history. A 12-month view will be available in a future release.
-
Cost is calculated using the hourly rate associated with each employee's job title. If an employee is missing a job title, their hours cannot be converted to cost and will be excluded from the planned and actual cost visuals.
-
To ensure complete cost reporting, confirm that every employee has a job title assigned in the Company Directory. See Edit a User Account in the Company Directory.
Vendor Performance Report
The Analytics Vendor Performance Report is a specialised tool designed to provide detailed insights into the performance of vendors and subcontractors involved in construction projects. This report leverages data from various Procore tools to help project managers and stakeholders assess and manage vendor performance, ensuring that all parties meet the project's quality, programme and budgetary requirements.
Current Versions
- 2.0 - 25.03.13
Procore Tools Used in the Vendor Performance Report
- Commitments
- Submittals
- Snag List
- RFIs
Report Pages
Vendor Overview
Original Commitment Breakdown
Commitment Change Events
Insights
BSA Compliance Scorecard (UK) Report Template
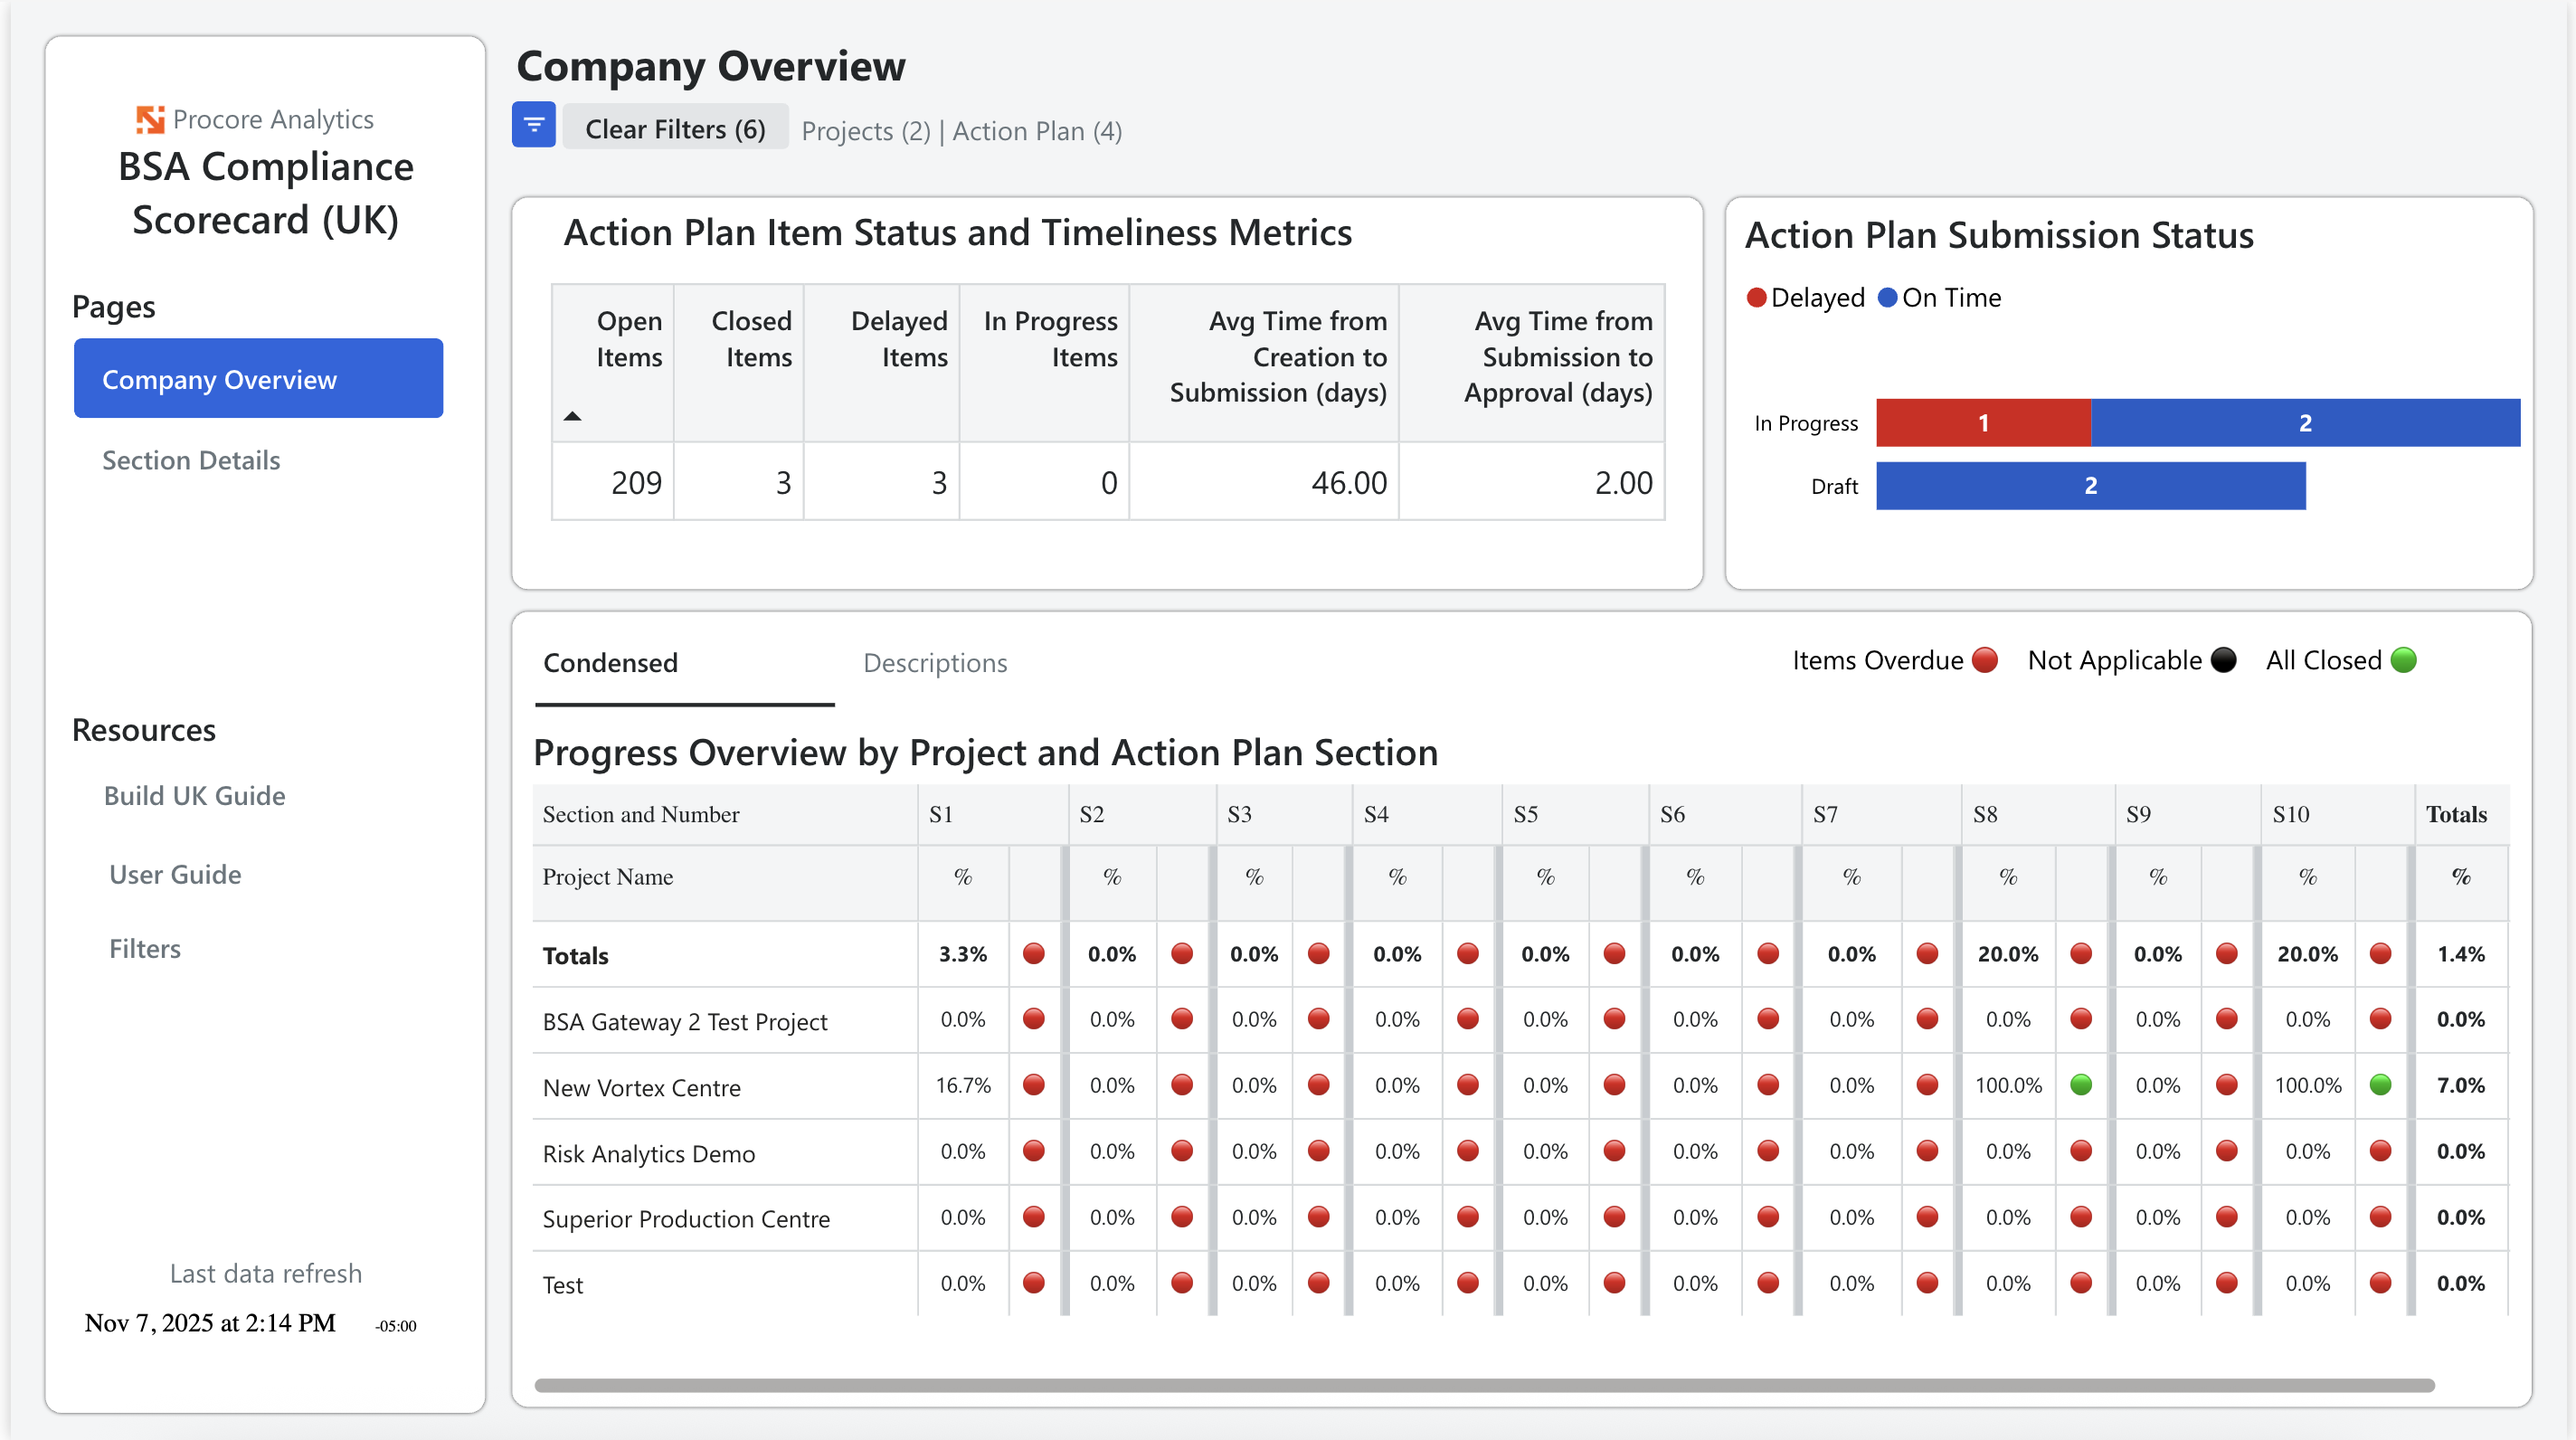
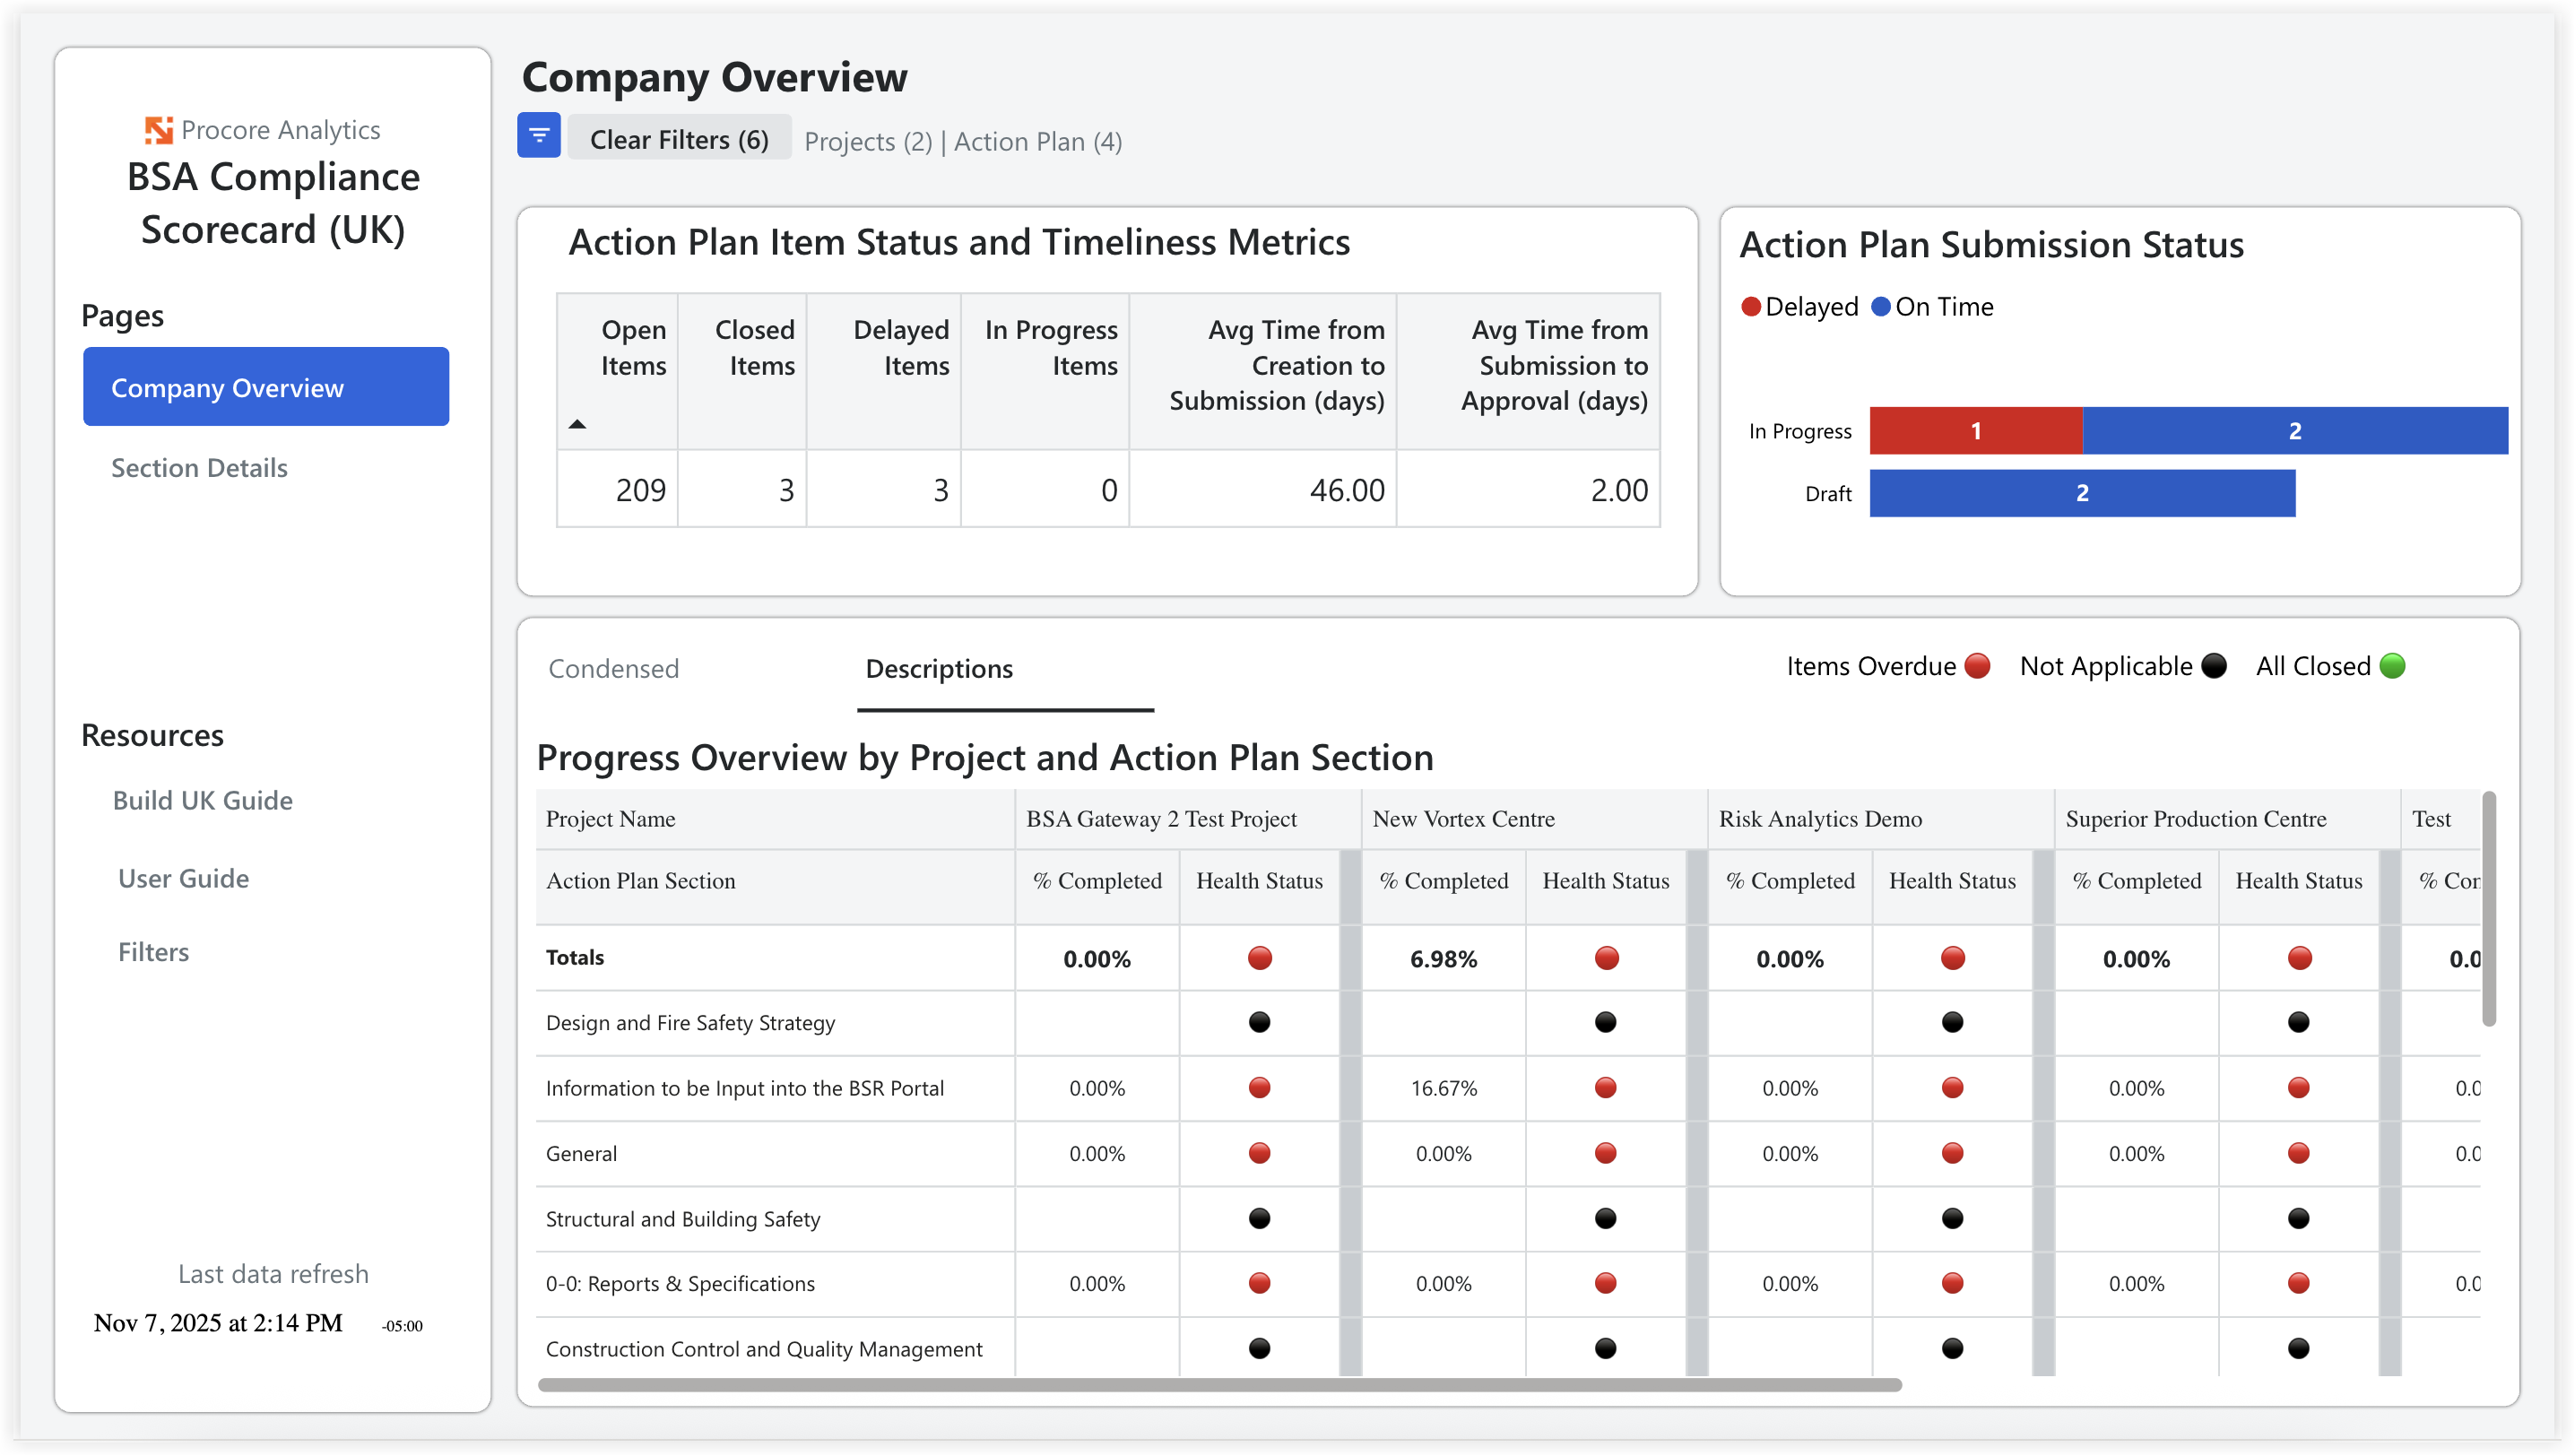
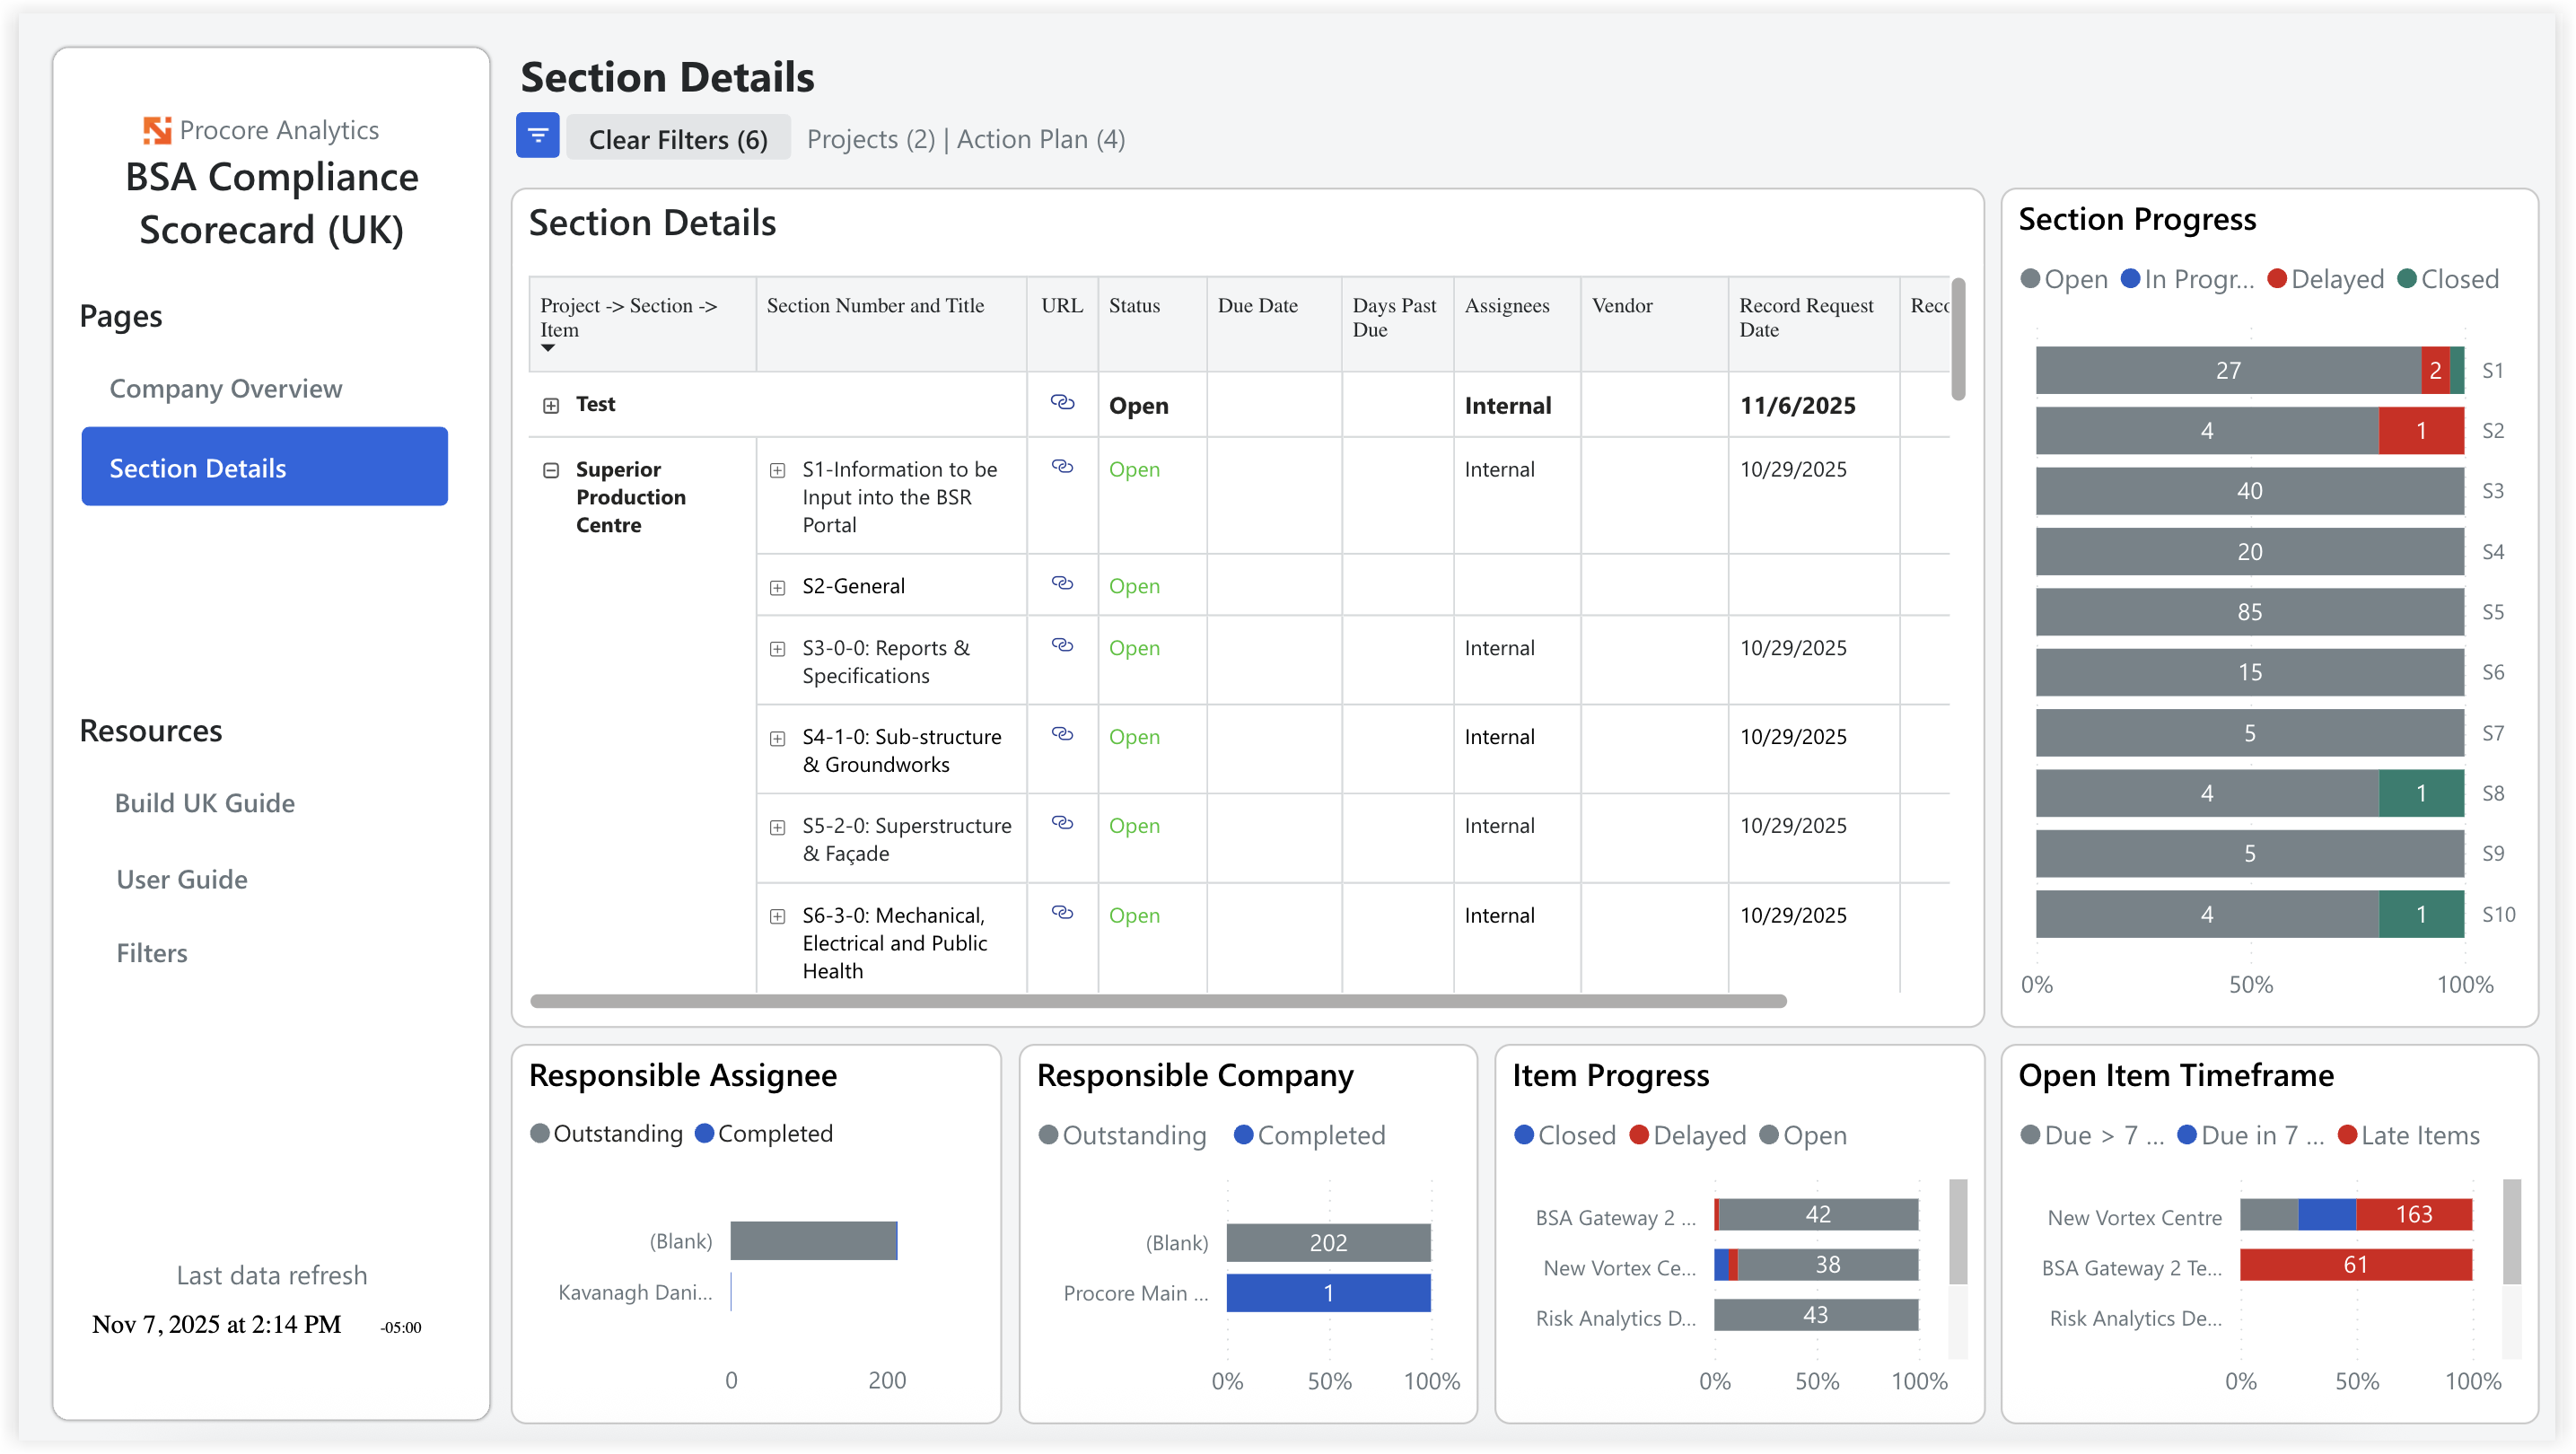
The Building Safety Act (BSA) Compliance Scorecard (UK) Report Template provides UK Dutyholders with an essential and auditable digital record to manage and demonstrate BSA compliance. It converts project data into clear, actionable metrics ranging from portfolio risk status to specific task management. This ensures adherence to best practices aligned with the Golden Thread principles and facilitates successful Gateway 2 submissions, ultimately reducing liability and minimizing regulatory delays.
Current Versions
-
1.0
Procore Tools Used in the BSA Compliance Scorecard (UK) Report Template
-
Action Plan
Report Pages
Company Overview
Section Details
Preconstruction Report (Beta)
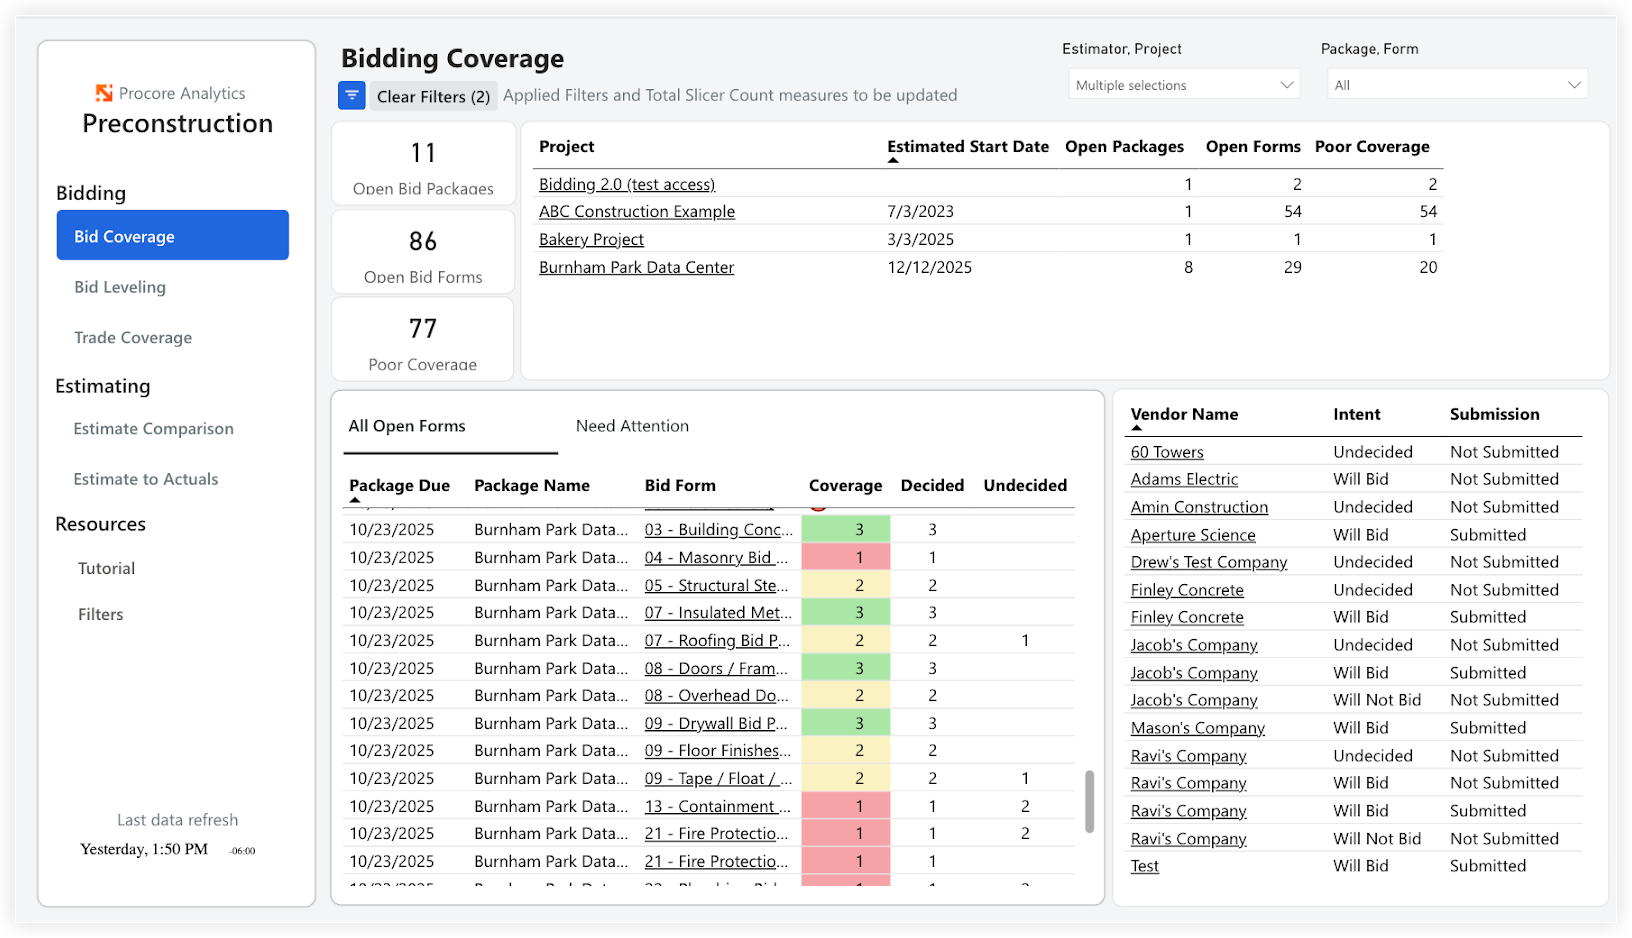
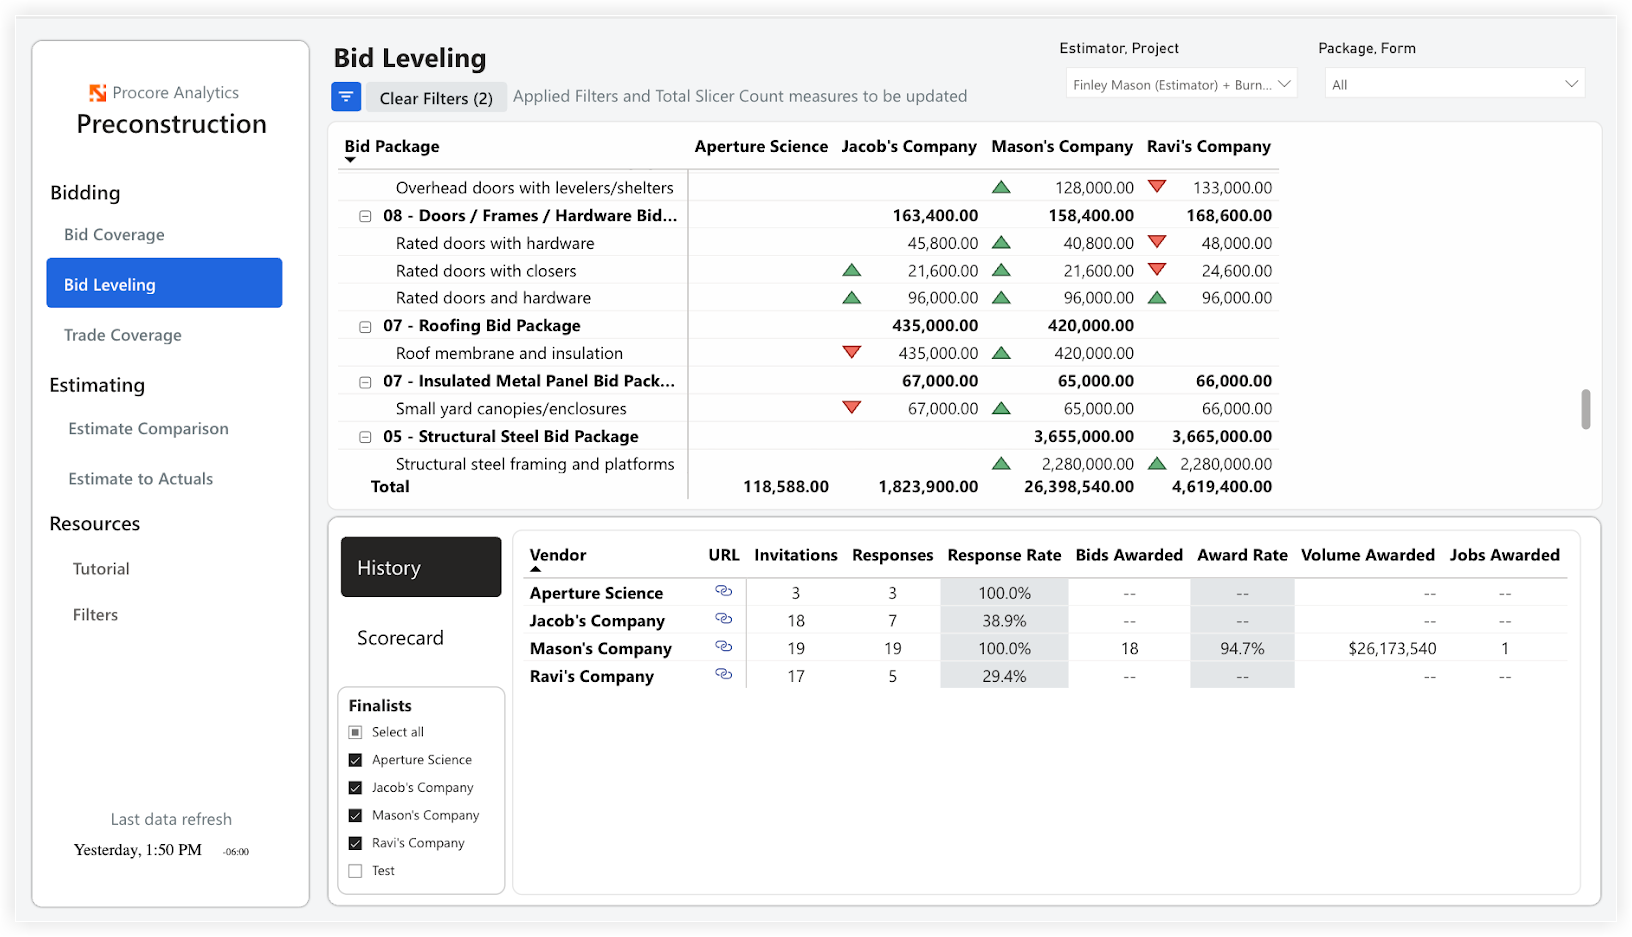
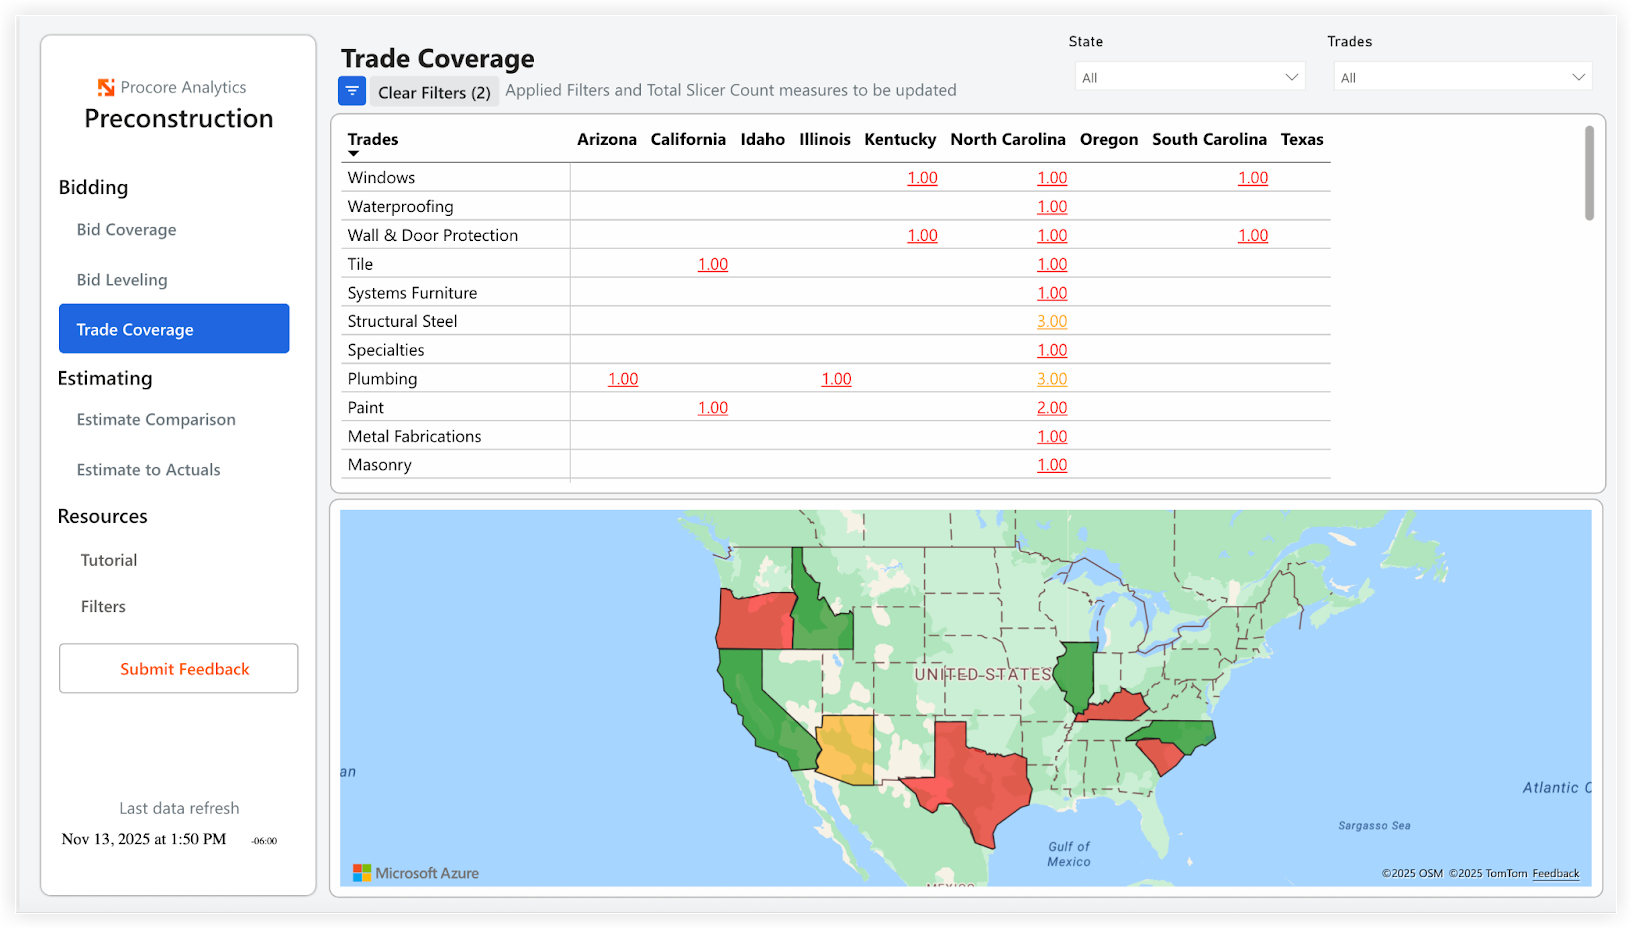
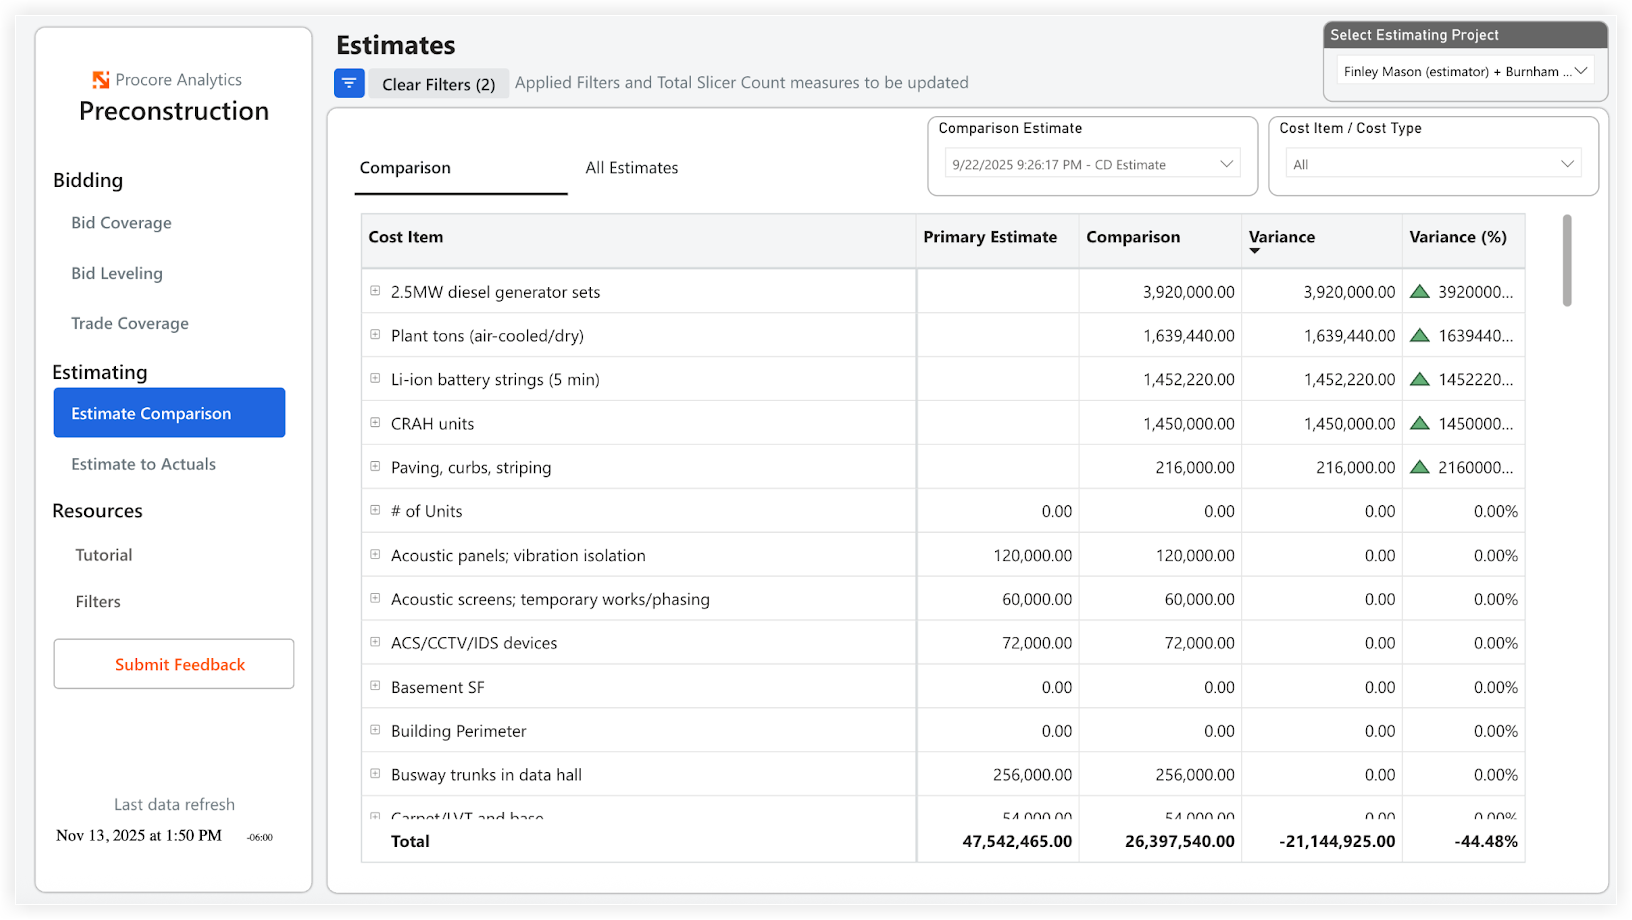
The Analytics Preconstruction Report provides immediate insight into the effectiveness of your tendering and estimating processes. It highlights packages with low coverage, allows for side-by-side tender comparisons, evaluates vendor reliability and tracks estimate accuracy throughout different design phases. With direct links to Procore for quick actions, this report enhances competition, improves cost control and supports more confident decision-making.
Current Versions
-
1.0
Procore Tools Used in the Preconstruction Report
-
Tendering
-
Estimating
Report Pages
Tender Coverage
Tender Levelling
Trade Coverage
Estimate Comparison
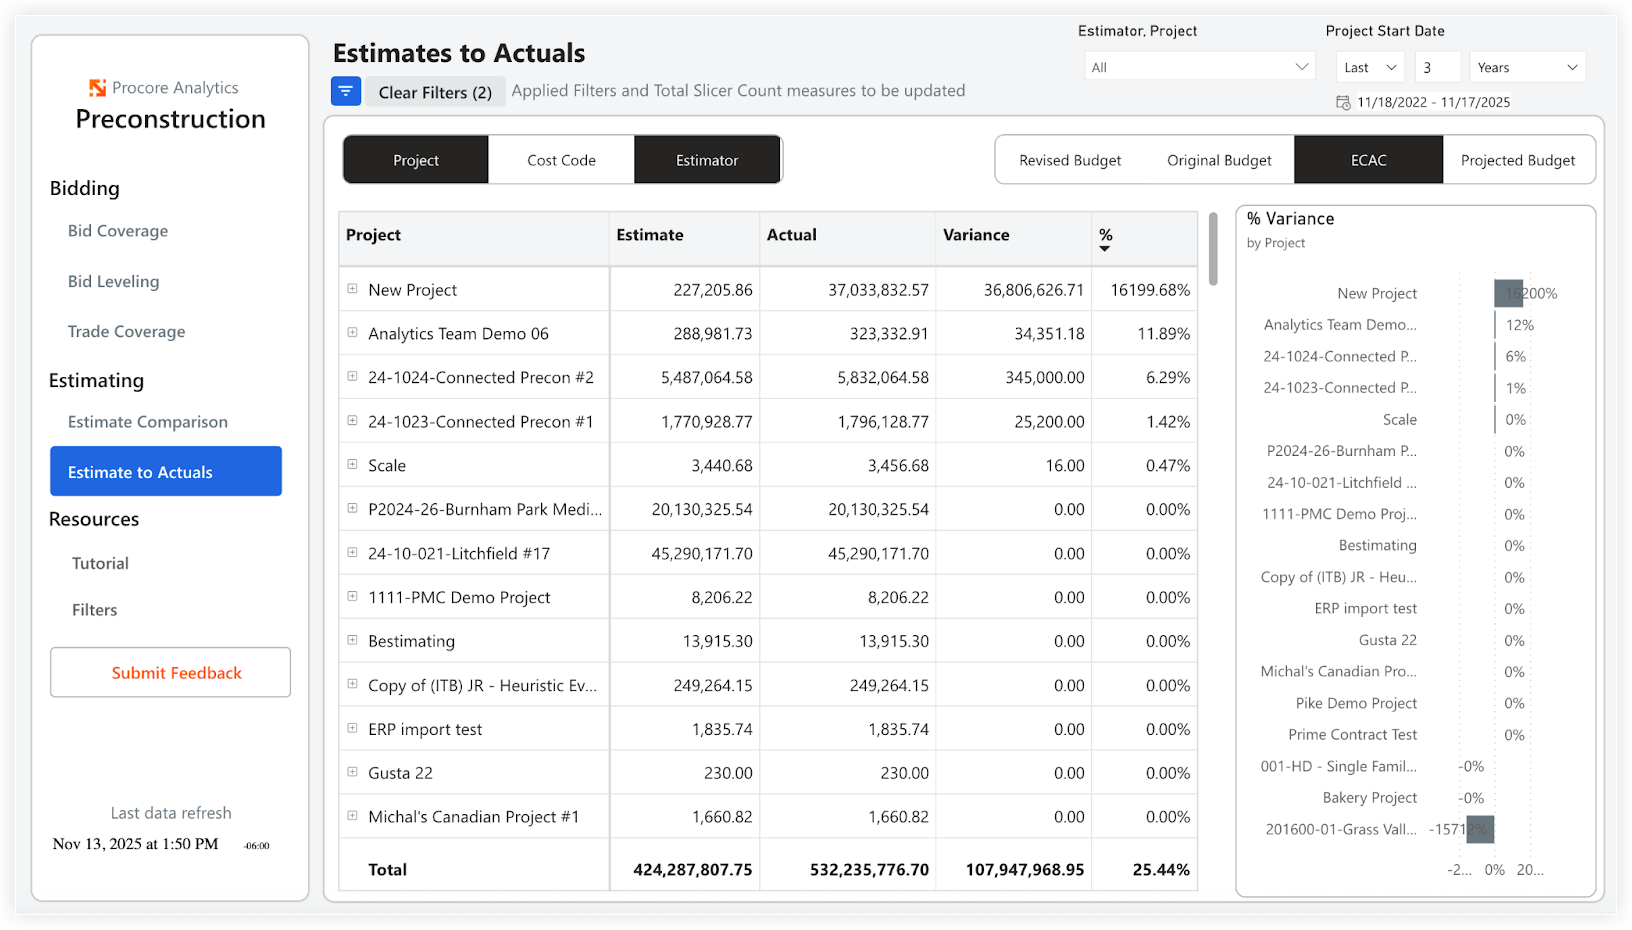
Estimate to Actuals