View a Project Programme
Objective
To view a project programme in the project's Programme tool.
Things to Consider
- Required User Permissions:
- 'Read Only' or higher permissions on the project's Programme tool.
- Additional Information:
- Calendar items can be used on the List, day, week and month views.
programme tasks vs. calendar items
Programme tasks in Procore are different from Calendar Items. Programme Tasks are tasks on a project programme uploaded to or created in Procore. Calendar Items are created in Procore in the List or Calendar view and will not show up on integrated programme in Procore.Steps
The following views are available for the Project level Programme tool:
List
- Navigate to the project's Programme tool.
- Click the List tab.
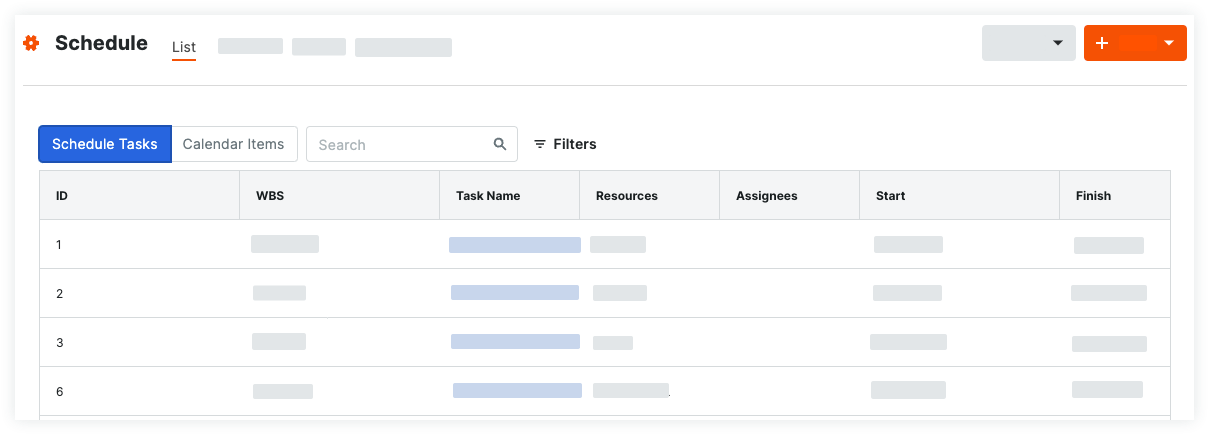
You will see a list of all programmed tasks, as well as their resource, WBS, start and finish date and percentage complete. You can also switch between viewing Programme Tasks and Calendar Items by clicking the toggle at the top of the list.
Calendar
The Calendar view gives you the options to look at a programme from a day, week or month view.
Day View
- Navigate to the project's Programme tool.
- Click the Calendar tab.
- Select Day from the Day, Week, Month toggle.
You will see a list of all tasks programmed for that day, as well as the resource, the start and finish date and the percentage complete for each task.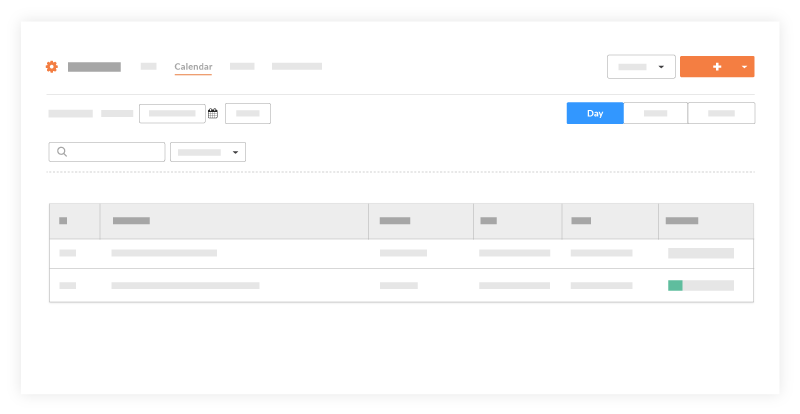
Week View
- Navigate to the project's Programme tool.
- Click the Calendar tab.
- Select Week from the Day, Week, Month toggle.
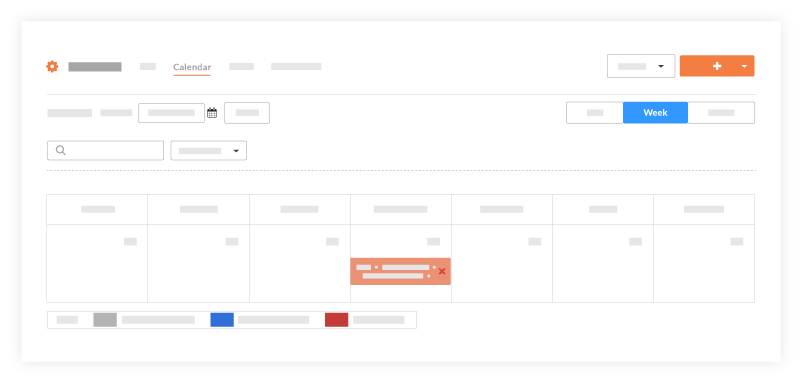
You will see the week's calendar with all completed tasks, tasks in progress and critical paths for that week.
Month View
- Navigate to the project's Programme tool.
- Click the Calendar tab.
- Select Month from the toggle.
You will see the month's calendar with all completed tasks, tasks in progress and critical paths for that month.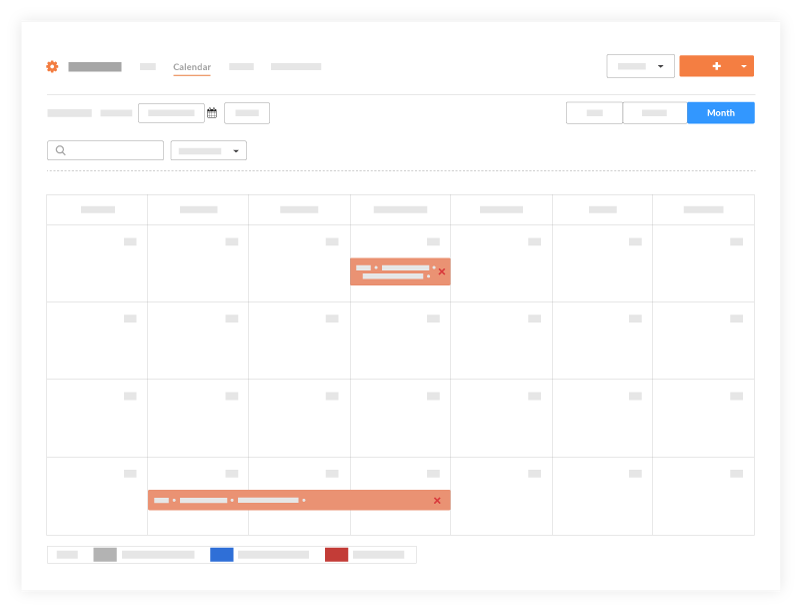
Gantt View
- Navigate to the project's Programme tool.
- Click the Gantt tab. See View a Gantt Programme.
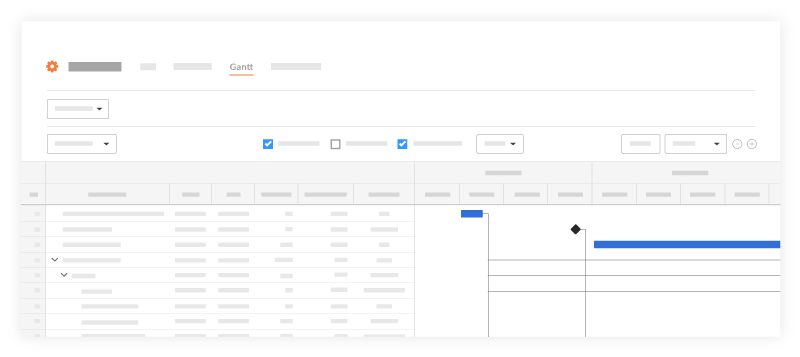
You will see a Gantt chart with horizontal bars that illustrate the amount of work done relative to the amount of time given to complete that task. The bars on the chart are based on your programme logic. See Update a Project Programme File.
Note: When Percent (%) Complete is enabled, the colour of the bars will have a lower saturation of colour to indicate the percentage that is complete.
The following options are available when viewing a Gantt chart:
- Configure Columns: Allows you to filter what columns are shown on the Gantt chart. Configured columns can also be sorted numerically or alphabetically depending on the field type.
- View Toggles: Allows you to filter what you want to show on the Gantt chart (critical paths, % complete, dependencies, etc.)
- Filter Options: Allows you to filter what you want to see on the Gantt chart. If you only want to see Critical Paths from a certain date range use the filter options to adjust the Gantt.
- Zoom Levels: Allows you to zoom in and out of the Gantt chart.
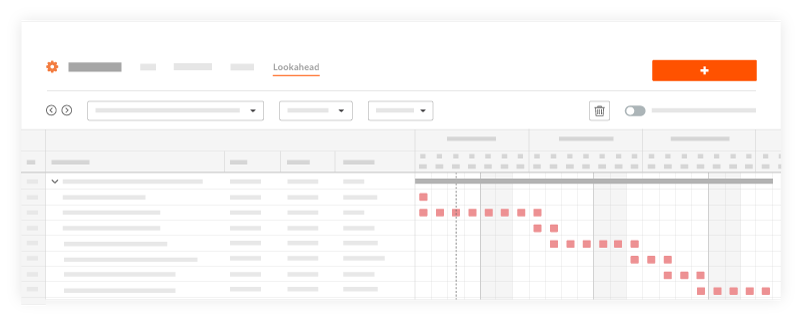
Lookaheads
- Navigate to the project's Programme tool.
- Click the Lookaheads tab.
You will see a lookahead showing the date range you selected. A Lookahead can be created to range from one to six weeks. See View Lookahead Programmes.
The following colours and symbols can be seen on a lookahead:

- Blue: Non-Critical
- Red: Critical
- Grey Hatch Pattern: Baselines compare to master programme
- Hazard Symbol: Date differs from the master programme
- Configure Columns: Allows you to filter what columns are shown on the lookahead.
- Filter Options: Allows you to filter what you want to see on the Gantt chart. If you only want to see Critical Paths from a certain date range use the filter options to adjust the Lookahead.
- Compare to Latest Master: Compares Lookaheads to items on the last master programme updated in Procore.
- Delete lookahead
 : Click the rubbish icon to delete lookaheads you've created.
