Aggregate Data in a Custom Project Report
Objective
To set up data aggregation on a custom project report.
Background
You can apply data aggregation functions to the columns in a custom report. Available functions include: Count, Sum, Min, Max, and Average.
Things to Consider
- Required User Permissions:
- 'Admin' level permissions on the Project level Reports tool
AND - 'Admin' level permissions on the Procore tool being used for the report's source data.
- 'Admin' level permissions on the Project level Reports tool
Steps
- Navigate to the Project level Reports tool.
- Locate the custom report in the Reports tab.
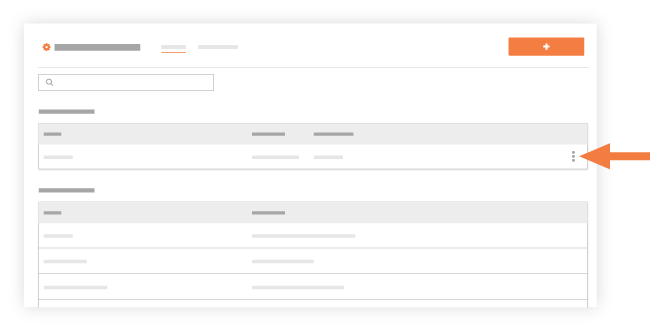
- Click the vertical ellipsis (⋮) and select Edit.
- Open the Group By menu and choose one of the listed options.
- Click the fx symbol in the report's column. Then choose one of the available aggregate functions from the drop-down menu:
Note: The option(s) that are available depend upon the type of data in the selected column. Field types that are not a numeric value only have the option to aggregate the data by count.- Count. The total number of records in the selected column.
- Sum. The total of all values in the selected column.
- Min. The minimum value in the selected column.
- Max. The maximum value in the selected column.
- Average. Uses the sum to calculate the average value in the selected column.
- Click Update Report.
Once the report is updated, you will see the Count, Sum, Min, Max or Average of the values at the bottom of the column.