View the Totals Dashboard
Objective
To view the Totals dashboard to see total people, days, hours and cost of people assigned and requested for each project or job title in the Resource Planning tool.
Background
The Totals dashboard helps you see current and future resource commitments to help you understand staffing and cost. See the total number of active people on your team, as well as how many people are assigned or requested for each project or job title. You can see totals by people, man days, hours or cost.
Things to Consider
- Required User Permissions
- A 'delta' is only available when viewing 'Total Cell Units' by 'People'.
Steps
Configure the Totals Dashboard
- Navigate to the Company level Resource Planning tool.
- Click Dashboard and select Totals.
- Select the Date and the number of Weeks you want to view.
Note: Selecting 1-8 weeks will show data by day, 16 weeks will show data by week, 6 months or more will show data by month. - Click Configure.
- Select to view totals by:
- Job Title. Job Titles listed are displayed in the same order as the hierarchy of Job Titles within your Settings. See Configure Job Titles for Resource Planning.
- Project.
- Optional: Mark the tickbox to Show Job Numbers
- Optional: Mark the tickbox to Show Categories
- Optional: mark the tickbox to Show Subcategories
- Select to 'Sort Projects by' Name, Project Number, Earliest Start Date or Earliest End Date.
- Select how to view 'Total Cell Units':
- People. The number of every active assignable person within the Group you are viewing.
Tip
When viewing Total Cell Units by people, you can see a 'delta'. The delta is the difference between the number of people requested and assigned and the total number of active assignable resources. This tells you whether you have enough manpower to meet current and forecasted needs or if you may need more resources to meet demand. - Man-Days. The Total Hours of all Assignments and Requests, divided by the paid hours per shift.
- Hours. The sum of all resource assignment and request hours.
- Cost. The total cost based on the hourly wage for every resource assignment and request.
- People. The number of every active assignable person within the Group you are viewing.
- Click Apply.
Reading the Totals Dashboard
Term Definitions
People
- Active Resources: The total number of assignable resources available for the selected Group and People filter.
- Assigned: The count of unique assignments for unique people made within the specified time period. If one person has two unique assignments during the specified time period, they will count as one.
- Time Off: The count of unique time off requests made within the specified time period. (Available up to 8 weeks view only)
- Requested: The count of unique requests made within the specified time period.
- Total: The sum of unique requests and assignments within the specified time period. Time off displays in parentheses.
- Delta: The difference between Active Resources and the Total within the specified time period.
Man Days
- Active Resources: The total number of assignable resources available for the selected Group and People filter.
- Assigned: The count of unique assignments multiplied by total hours and divided by paid hours per shift number within the specified time period.
Note: The default number of paid hours is 8 and can be adjusted in your costing settings. See Configure Costing in Resource Planning. - Time Off: The count of unique time off records made multiplied by total hours and divided by paid hours per shift number within the specified time period.
Note: This is only available up to the 8 weeks view. - Requested: The count of unique requests multiplied by total hours and divided by paid hours per shift number within the specified time period.
- Total: The sum of unique requests and assignments within the specified time period. Time off displays in parentheses.
Hours
Note: The calculation for hours may be different If assignment hours are more than the paid hours per shift number and overtime was not selected on the assignment.
- Active Resources: The total number of assignable resources available for the selected Group and People filter.
- Assigned: The count of working hours for assignments made within the specified time period.
- Time Off: The count of working hours for time off records within the specified time period.
Note: This is only available up to the 8 weeks view. - Requested: The count of working hours for requests within the specified time period.
- Total: The sum of hours for requests and assignments within a specified time period. Time off displays in parentheses.
Understanding the Delta
When viewing Total Cell Units by people, you can see a delta. The delta is the difference between the number of people requested and assigned and the total number of active assignable resources. This tells you whether you have enough manpower to meet current and forecasted needs or if you may need more resources to meet demand.
|
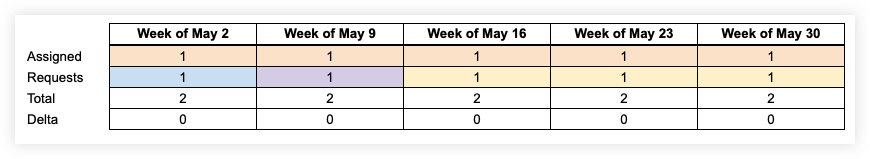
In this simple Totals Dashboard example, there are the following number assignments, requests and of people that can be assigned:
|
 |
|
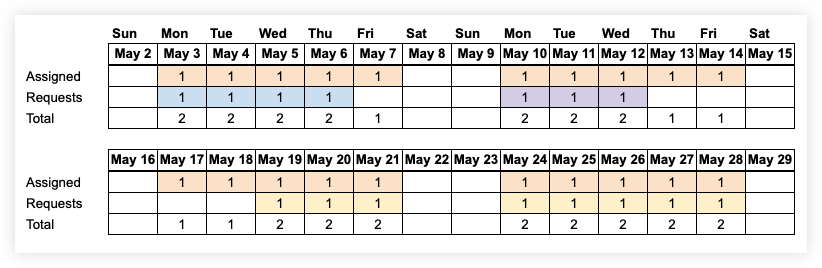
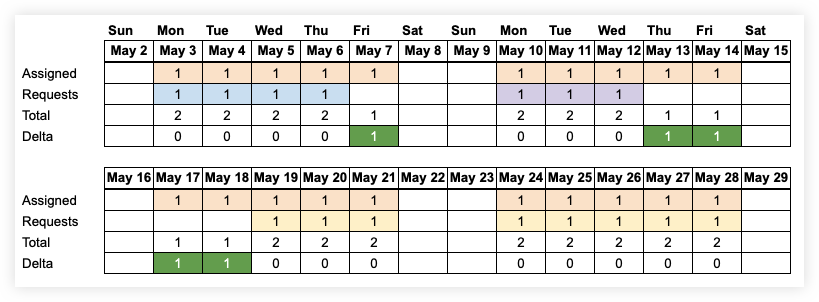
When you select to view data from 1-8 weeks, you will see the daily delta. For days when there is one person requested and one person assigned, the delta is 0. One of the people is assigned and the other person could fulfill the request, leaving 0 people available that day. For days when there there is one person assigned and no requests, there is a delta of 1, meaning there is 1 person available that day. |
 |
|
When you select to view data for 13 weeks, you will see the weekly delta. For all weeks, there was one person assigned and one person requested that the other person could fulfill. This makes the delta 0 for the week. |
|
|
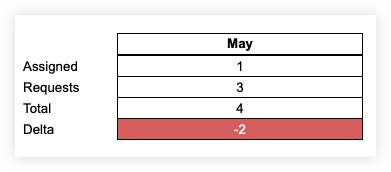
When you select to view data for 6 months or more, you will see the monthly delta. In this case, there is one person assigned and three separate requests for people. Because there are four people requested or assigned for the month and there are only two assignable people, the delta is -2 for the month. As you can see with the daily and weekly deltas, having a negative delta in the month view does not necessarily mean that there are not enough resources. It depends on the dates of the requests and assignments and the skill set of your workforce. |
 |