View the Health Dashboard in the Portfolio Tool
Objective
To view the Health Dashboard in the company's Portfolio tool.
Background
This Portfolio tool's Health Dashboard turns individual project information into business intelligence by aggregating your company's data across project and tools—giving you a powerful snapshot of your entire portfolio's overall project health. With the Health Dashboard, users now have the capability to review simple, but effective, data visualizations that provide greater insights into how the project's across your company's entire Portfolio are performing. By examining a wide range of project data points and financial metrics, the Health Dashboard also highlights projects and issues that may need your attention.
Things to Consider
- Required User Permission:
- To access the Portfolio tool, 'Read Only' or higher on the company's Portfolio tool.
AND - To view the Health Dashboard tab in the Portfolio tool, 'Standard' or higher on the company's Reports tool.
Notes:- If you are a user with 'Admin' level permission, you will be able to view all projects.
- If you are a user with 'Standard' level permission, you will be able to view projects to which your user profile is added to the Project Directory.
- The 'Is an Employee of
' check box must be selected in your user profile.
- To view the Financial Health area of the dashboard, 'Admin' permission on the company's Admin tool and 'Standard' or higher on the project's Budget tool. For more details, see Set Up a Budget View for Custom Reporting
Notes:- The Financial Health area of the dashboard limits the display of data to the project budget(s) that you have permission to access.
- For example, if you only have access permission to three (3) project budgets, the data is only for those three (3) projects. If you have access permission to all projects, it shows data for all projects.
- To access the Portfolio tool, 'Read Only' or higher on the company's Portfolio tool.
- Recommendations:
To get the most out of your Health Dashboard, it is recommended that you (or an authorized user at your company) create the following items for use with Procore:- Configure the Budget tool to use the 'Procore Standard Budget (Custom Reporting View)' view. This is Procore's default setting. See Set Up a Custom Reporting Budget View.
Note: If the health dashboard is not displaying budget information, see Why is my Financial Health Dashboard not configured? - The selections that appear in the Add Filters drop-down menu are created in other tools. For instructions, see one of these tutorials:
- Departments. See Add a Custom Department.
- Project Names. See Add a New Project or Change the Name of a Procore Project.
- Programs. See Add a Custom Program.
- Regions. See Add a Custom Project Region.
- Stages. See Add a Custom Project Stage.
- Configure the Budget tool to use the 'Procore Standard Budget (Custom Reporting View)' view. This is Procore's default setting. See Set Up a Custom Reporting Budget View.
- Limitations:
- Currently, the widgets in the Health Dashboard default configuration settings cannot be customised.
Steps
View the Health Dashboard
- Navigate to your company's Portfolio tool.
The Portfolio page appears. After you create a project, this page lists all the projects in your company's Procore account. - Click Health Dashboard.
This reveals the Health Dashboard. - In the Financial Health area, evaluate the data as follows:
Notes:- To learn how to use the Add Filter menu, see Add Filters to the Health Dashboard.
- Currently, the configuration settings for the widgets in the Health Dashboard cannot be customised.
- The data you can view in the Financial Health area depends upon the permissions you've been granted to the Budget tools in your projects.
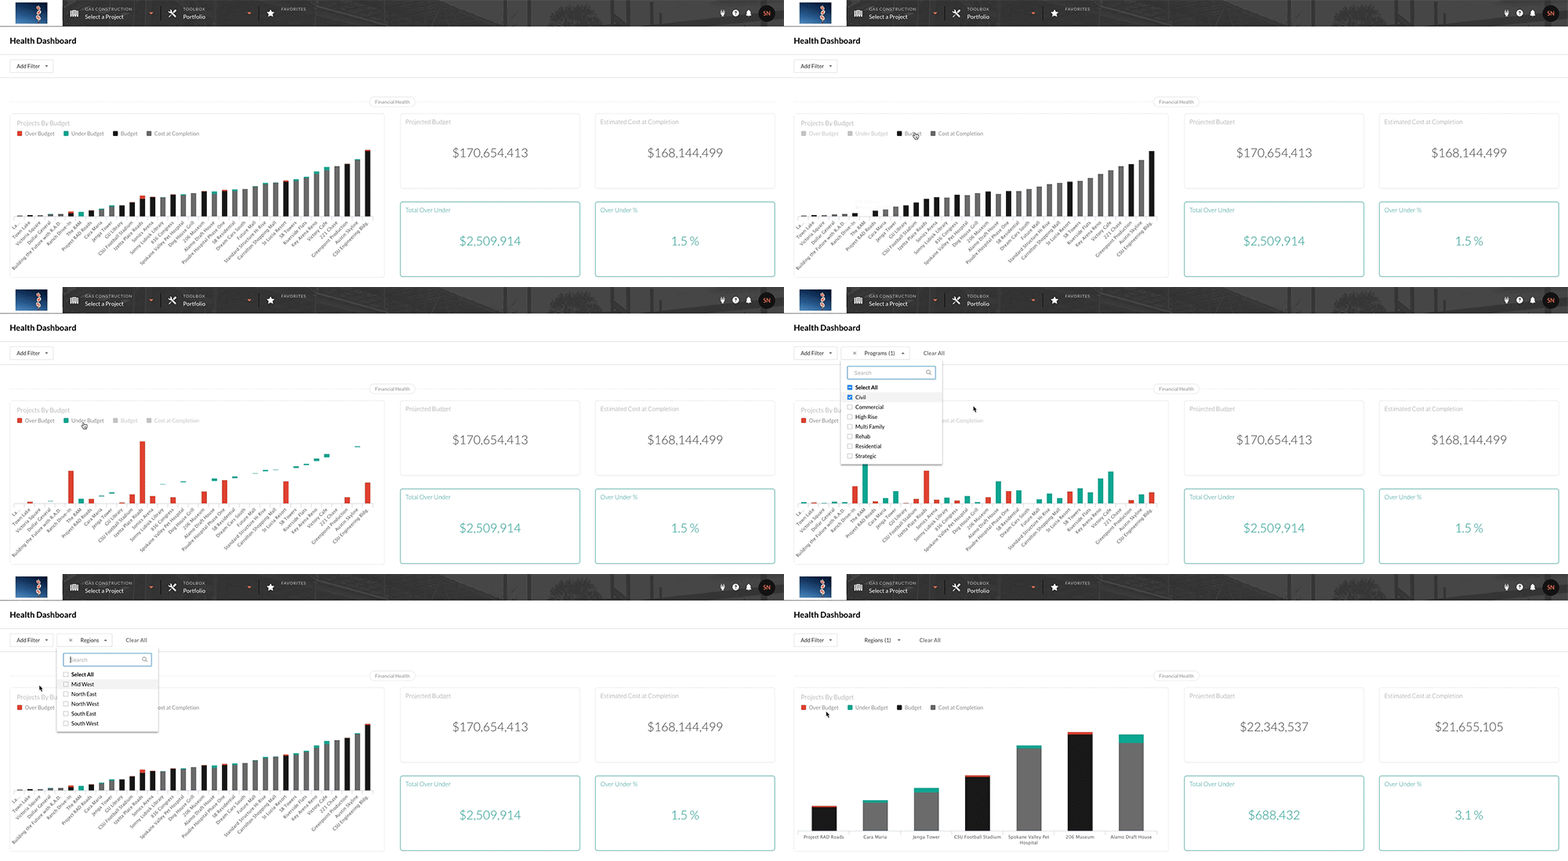
- Projects by Budget
Reveals a bar chart showing the Procore projects in your company's account by their budgeted amounts (i.e., lowest to highest from left to right). Click the colour-coded labels in the legend to adjust the projects in view to quickly pinpoint those that are Over Budget and Under Budget, as well as to compare each project's Budget and Cost at Completion. See Set up a Budget. - Projected Budget
Reveals a snapshot of the estimated future financial performance across every project in your company's Portfolio tool. - Estimated Cost at Completion
Provides a snapshot of your project's total estimated costs at project completion. - Total Over Under
Shows the aggregated total (i.e., over budget or under budget) for the project's in your company's Portfolio tool. A GREEN outline and text indicates your projects are under budget. A RED outline and text indicates your projects are over budget. - Over Under %
Shows the percentage by which your projects are over or under the projected budget. This value is determined by taking the difference between projected budget and estimated cost at completion and dividing it by the projected budget.

- Projects by Budget
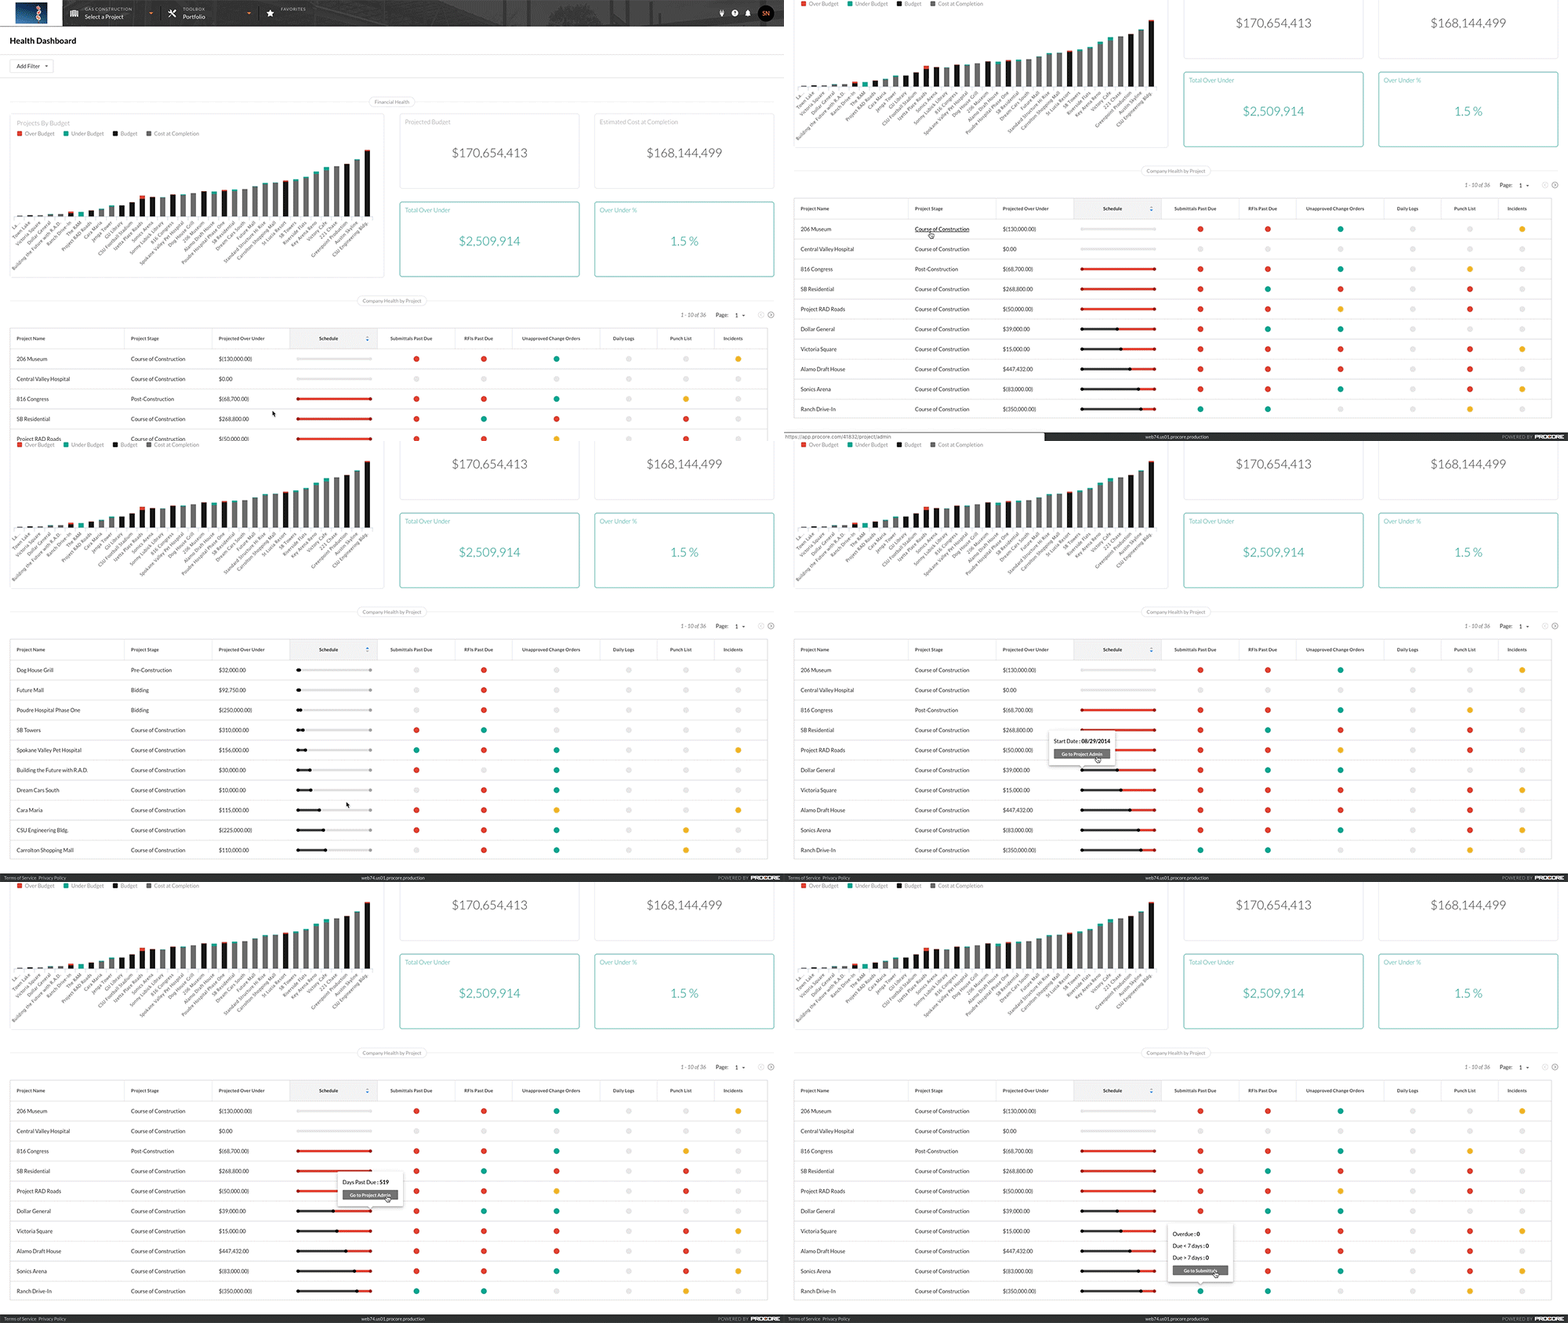
- Scroll down to the Company Health by Project area. A table lists the following data for you to evaluate:
Notes:- You can hover over data fields to view more specific information.
- You can view all of the data in the table. However, you will need permission to the corresponding Procore tool to navigate to other tools using these steps:
- Click the button in the tooltip that appears to open the corresponding tool in a new browser tab.
- Click the hyperlinks in Procore Name, Project Stage, and Projected Over Under columns to open the corresponding tool in a new browser tab.
- If you are a user with 'Standard' level permission, you will be able to view projects to which your user profile is added to the Project Directory.

- Project Name
Lists the project's name as entered in the system. See Add a New Project or Change the Name of a Procore Project. Click the project name's hyperlink to open the project's Home page in a new browser tab. See About the Project Home Page. - Project Stage
Reveals each project's current stage. To create custom project stages for use in Procore, see Add a Custom Project Stage. To change the stage setting for a Procore project, see Change a Project's Stage of Construction. Click the project stage hyperlink to open the Project Admin tool in a new browser tab. See Admin. - Projected Over Under
Shows the total amount over or under budget for each listed project. See Set up a New Budget View and Set up a Budget.
Note: If you have 'Admin' level permission on the Budget tool, click the hyperlink in the Projected Over Under column to open the project's Budget tool in a new browser tab. See Budget. - Programme
Provides a horizontal graph that users can hover their mouse cursor over to reveal details about the project programme: Start Date, Completion date and Days Past Due. Click the Go to Programme button to open the Project Admin tool (Note: The dates in this graph correspond to either the (1) Estimated Start Date and the Estimated Completion Date or (2) the Actual Start Date and Projected Finish Date). To learn more about the colour codes on the indicator, see Health Dashboard Threshold Settings: Programme. - Submittals Past Due
Provides a colour-coded dot that users can hover their mouse cursor over to reveal the status of a project's submittals. Click the Go to Submittals button to open the Submittals tool. To learn about the colour-codes on the indicator, see Health Dashboard Threshold Settings: Submittals. - RFIs Past Due
Provides a colour-coded indicator that users can hover their mouse cursor over to reveal the status of a project's RFIs. Click the Go to RFIs button to open the RFIs tool. To learn about the colour-codes on the indicator, see Health Dashboard Threshold Settings: RFIs. - Unapproved Variations
Provides a colour-coded indicator that users can hover their mouse cursor over to reveal the status of a projects open variations in an unapproved status. Click the Go to Variations button to open the Variations tool. To learn more, see Health Dashboard Threshold Settings: Unapproved Variations. - Site Diary
Provides a colour-coded indicator that users can hover their mouse cursor over for a better understanding of when a Manpower Diary (see Create Manpower Entries) or Notes Diary (see Create Notes Entries) were created in the project's Site Diary tool. This indicator looks at the last seven (7) days to report on the actual date the diary entry was created and NOT the date for which the entries themselves were added). Click the Go to Site Diary button to open the Site Diary tool. To learn more, see Health Dashboard Threshold Settings: Site Diaries. - snag list
Provides a color-coded indicator that users can hover their mouse cursor over to reveal the status of snag list items on a project. Click the Go to snag list button to open the snag list tool. To learn more, see Health Dashboard Threshold Settings: snag list. - Incidents
Provides a colour-coded indicator that users can hover their mouse cursor over to reveal the status of incidents on a project. Click the Go to Incidents button to open the Incidents tool. To learn more, see Health Dashboard Threshold Settings: Incidents.
- Project Name
Add Filters to the Health Dashboard
If you want to apply filters to narrow the viewable information displaying in the Health Dashboard, select one of these options from the Add Filter drop-down list at the top of the Health Dashboard page. When you select an option from the drop-down menu, you will be presented with a secondary drop-down list from which you can select secondary filters to narrow the list on the dashboard further.
- To add a filter to the dashboard, place a tick in the corresponding box in the drop-down menu. The filters you apply will update the charts, tiles and tables.
- To clear all filters from the dashboard, click Clear All.


